


 Introduction
Logical Venn Diagrams, the primary point is to test the capacity of a candidate about the relation between a few things of a gathering by diagrams. In these questions, some figures of circles and some words are given. The candidate is required to pick a figure which speaks to the given words.
The article Venn Diagrams Practice Quiz 4 provides information about Venn Diagrams. The Reasoning Ability section primarily has questions with solutions are mentioned below Venn Diagrams Practice Quiz 4 sets and also useful for candidates preparing for different competitive examinations like RRB, RRB ALP/Technical Exams/Junior Engineer Recruitment Exams, SSC CGL, SSC CHSL, IBPS, SBI PO, SBI Clerks, CAT, etc.,.
Quiz
Directions(1 - 5): Study the following figure and answer the questions given below.
There are 450 students in a college. Each student has to choose one or more elective out of management, history and physics. Further following information is also known –
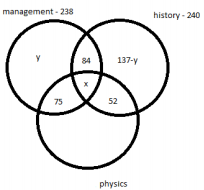 Considering students who took management as an elective we have,
y + x + 84 + 75 = 238
x + y = 79
Considering students who took history as an elective we have,
137 – y + x + 84 + 52 = 240
y – x = 33
Adding both the equation we get,
2y = 112
y = 56
So, x = 23
So, number of students who took all the three electives = 23
Number of students who took only management = 56
Number of students who took only history = 137 – 56 = 81
So, the number of students who took only physics = 450 – 240 – 56 – 75 = 79
Thus, we get following venn diagram –
Considering students who took management as an elective we have,
y + x + 84 + 75 = 238
x + y = 79
Considering students who took history as an elective we have,
137 – y + x + 84 + 52 = 240
y – x = 33
Adding both the equation we get,
2y = 112
y = 56
So, x = 23
So, number of students who took all the three electives = 23
Number of students who took only management = 56
Number of students who took only history = 137 – 56 = 81
So, the number of students who took only physics = 450 – 240 – 56 – 75 = 79
Thus, we get following venn diagram –
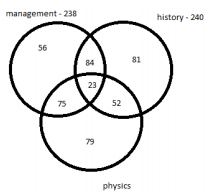 Number of students who selected both management and physics as elective = 75 + 23 = 98
2. How many students selected only management as an elective?
Number of students who selected both management and physics as elective = 75 + 23 = 98
2. How many students selected only management as an elective?
-
1) 75 students selected only management and physics.
2) 84 students selected only management and history.
3) 52 students selected only physics and history.
4) The number of students who selected only history is 137 less the number of students who selected only management.
5) In total 238 students selected management as an elective.
6) In total 240 students selected history as an elective.
- A. 84
B. 107
C. 75
D. 96
- A. 56
B. 45
C. 58
D. 62
- A. 78
B. 91
C. 81
D. 93
- A. 16
B. 29
C. 37
D. 23
- A. 134
B. 79
C. 67
D. 93
Directions(1-5): Study the following figure and answer the questions given below.
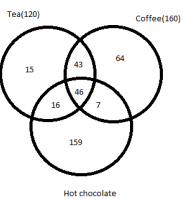
350 people are living in a particular village. There are three drinks Tea, Coffee and Hot chocolate available in the village. Each citizen has to vote for one or more of the three drinks which he/she like. It is known that:
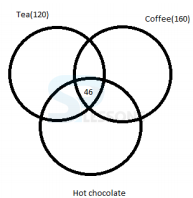 Since 62 people like both Tea and Hot chocolate
62 – 46 = 16 people like only Tea and Hot chocolate
Since 53 people like both Hot chocolate and Coffee
53 – 46 = 7 people like only Hot chocolate and Coffee
Since 89 people like both Tea and Coffee
89 – 46 = 43 people like only Tea and Coffee.
Thus, number of people who like only Tea = 120 – 46 – 16 – 43 = 15
Thus, number of people who like only Coffee= 160 – 43 – 46 – 7 = 64
Number of people who like only Hot chocolate = 350 – 160 – 16 – 15 = 159
We get following venn diagram –
Since 62 people like both Tea and Hot chocolate
62 – 46 = 16 people like only Tea and Hot chocolate
Since 53 people like both Hot chocolate and Coffee
53 – 46 = 7 people like only Hot chocolate and Coffee
Since 89 people like both Tea and Coffee
89 – 46 = 43 people like only Tea and Coffee.
Thus, number of people who like only Tea = 120 – 46 – 16 – 43 = 15
Thus, number of people who like only Coffee= 160 – 43 – 46 – 7 = 64
Number of people who like only Hot chocolate = 350 – 160 – 16 – 15 = 159
We get following venn diagram –
 2. How many people like only Tea and Coffee?
-
1) In total 120 people like Tea and 160 people like Coffee.
2) 46 people like all the three drinks.
3) 62 people like both Tea and Hot chocolate.
4) 53 people like both Hot chocolate and Coffee.
5) 89 people like both Tea and Coffee.
- A. 14
B. 17
C. 9
D. 15
- A. 43
B. 35
C. 47
D. 39
- A. 8
B. 11
C. 7
D. 13
- A. 56
B. 59
C. 70
D. 64
- A. 124
B. 159
C. 47
D. 163
Directions(1-5): Study the following figure and answer the questions given below.
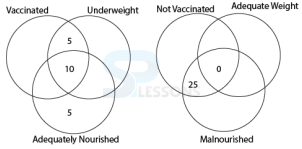
The results of annual health inspection of 100 schoolchildren is given in the following venn diagrams. It was discovered that 55% of the children were malnourished while 60% were underweight.
 1. How many students are vaccinated?
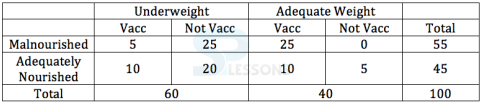 Hence, total number of students who are vaccinated = 5 + 10 + 25 + 10 = 50
2. Among students who are not vaccinated and underweight, what proportion are malnourished?
Hence, total number of students who are vaccinated = 5 + 10 + 25 + 10 = 50
2. Among students who are not vaccinated and underweight, what proportion are malnourished?
- A. 40
B. 45
C. 50
D. 60
- A. [latex]\frac {1}{3}[/latex]
B. [latex]\frac {1}{4}[/latex]
C. [latex]\frac {4}{9}[/latex]
D. [latex]\frac {5}{9}[/latex]
- A. 0
B. 5
C. 10
D. 15
- A. 1 : 3
B. 1: 4
C. 1 : 2
D. 2 : 5
- A. 0
B. 5
C. 15
D. 10