


 Introduction
What is data interpretation?
Data Interpretation or DI refers to the implementation of procedures through which data is reviewed for the purpose of arriving at an inference. Data can be obtained from multiple sources.
Example: data from running of industries, census population data etc.
Data Interpretation is one of important topic in Quantitative Aptitude Section. In Data Interpretation Quiz 15 article candidates can find questions with answer. By solving this questions candidates can improve and maintain, speed, and accuracy in the exams. Data Interpretation Quiz 15 questions are very useful for different exams such as IBPS PO, Clerk, SSC CGL, SBI PO, NIACL Assistant, NICL AO, IBPS SO, RRB, Railways, Civil Services etc.
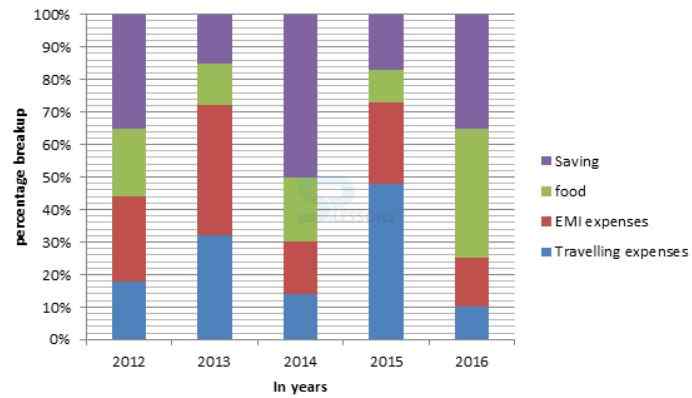
Direction(1-5): Read the table carefully and answer the related questions to etc. The above table represents the population of a certain city.
Q1
If the ratio on saving in the year 2013 and 2016 are in the ratio 3 : 5. Then what is the ratio of EMI expenses in the year 2013 and 2016.
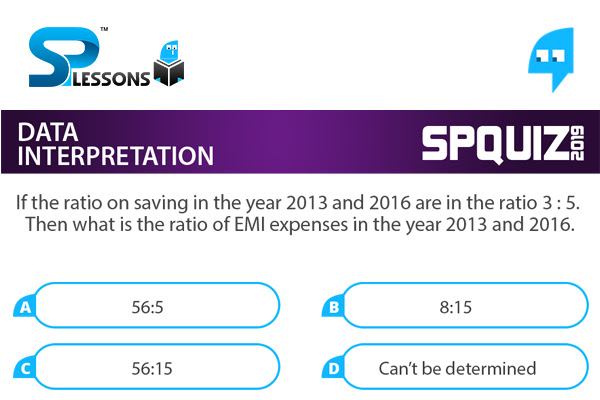
- A. 56:5
B. 8:15
C. 56:15
D. Can’t be determined
Let total salary in 2013 be INR x
Total salary in 2016 be INR y
According to the given information:
The ratio on saving in the year 2013 and 2016 are in the ratio 3 : 5.
[latex]\Rightarrow = \frac {15% of x}{35% of y} = \frac {3}{5}[/latex]
[latex]\Rightarrow = \frac {x}{y} = \frac {3}{5} \times \frac {35}{15} = \frac {7}{5}[/latex] _______ (1)
∴ Ratio of EMI expenses = [latex]\frac {40% of x}{15% of y}[/latex]
⇒ Ratio of EMI expenses = [latex]\frac {0.4 x}{0.15 y}[/latex]
Now taking the values of [latex]\frac {x}{y}[/latex] from (1)
⇒ Ratio of EMI expenses = [latex]\frac {7}{5} \times \frac {40}{15} = 56 : 15[/latex]
Hence, the required ratio is 56: 15
Q2
If the saving in 2012 is 4/5 th of the saving in 2014. Then what is the total expenditure spent on food in 2012. (Given that total expense in 2014 is INR 1,85,000)
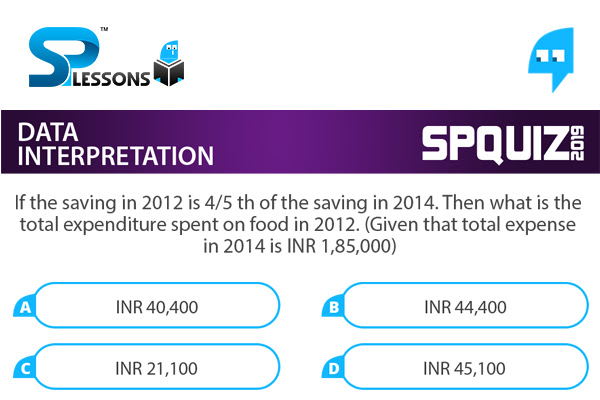
- A. INR 40,400
B. INR 44,400
C. INR 21,100
D. INR 45,100
Total expense in 2014 = INR 1, 85,000
⇒Saving in 2014 = 50% of 1, 85,000
⇒Saving in 2014 = INR 92,500
According to the given information:
The saving in 2012 is [latex] \frac {4}{5}[/latex] th of the saving in 2014
∴Saving in 2012 = [latex] \frac {4}{5}[/latex] × 92,500 = INR 74,000
Let the total expense in 2012 be INR x
∴35% of x = 74,000
⇒ x = [latex]\frac {74000 \times 100}{35}[/latex]
Now, expenditure on food in 2012 is 21% of x
⇒Expenditure on food in 2012 = [latex] \frac {74000 \times 100}{35} \times \frac {21}{100}[/latex]
⇒Expenditure on food in 2012 = INR 44,400
Q3
Every year there is an increase of 100% in monthly salary as compared to previous year’s monthly salary then what is the ratio of monthly salary in 2016 to the expenses on travelling in 2013.
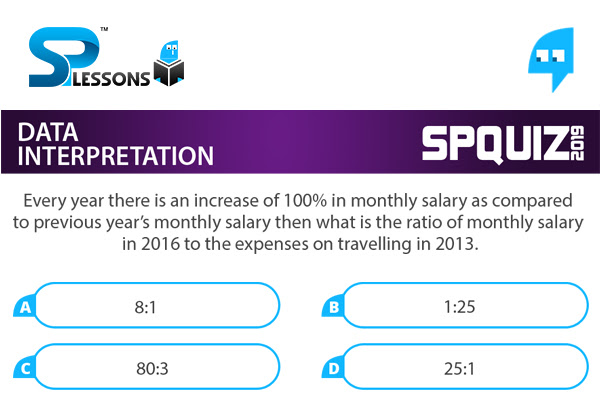
- A. 8:1
B. 1:25
C. 80:3
D. 25:1
Let the monthly salary in 2013 be INR 100
According to the given information:
Every year there is an increase of 100% in monthly salary as compared to previous year’s monthly salary
Then salary in 2014 = INR 200
⇒Salary in 2015 = INR 400
⇒Salary in 2016 = INR 800
Now, expenses on travelling in 2013 = 32% of salary
⇒Expenses on travelling in 2013 = INR 32
∴ Required ratio = [latex] \frac {800}{32}[/latex] = 25: 1
Q4
If the total expenses in year 2011 is INR 3, 00,000 and there is an increase of 18% in 2012. Then how much Sunil has spent on travelling and EMI combine in 2012?
- A. INR 1,53,740
B. INR 1,50,740
C. INR 92,400
D. INR 1,55,760
Total expenses in year 2011 = INR 3, 00,000
There is an increase of 18%
∴Total expense in 2012 = 3, 00,000 + 18% of 3,00,000
⇒Total expense in 2012 = INR 3, 54,000
Now, Expense on travelling in 2012 = 18% of 3, 54,000
⇒Expense on travelling in 2012 = INR 63,720
EMI expense in 2012 = 26% of 3, 54,000
⇒EMI expense in 2012 = INR 92,040
Combine expense = 63,720 + 92,040 = INR 1, 55,760
Q5
What approx. percentage of average money spend by Sunil on food to that of average money saved by him during all these years if his salary per annum was INR 5,00,000
- A. 65%
B. 70%
C. 68%
D. 66%
Money spend by Sunil on food = 21% + 13% + 20% + 10% + 40%
Average money spend by Sunil on food = [latex]\frac {104}{5}[/latex] = 20.8% of 5, 00,000
⇒Average money spend by Sunil on food = INR 1, 04,000
Now, Money saved by Sunil = 35% + 15% + 50% + 17% + 35%
Average money saved by Sunil = [latex]\frac {152}{5}[/latex] = 30.4% of 5, 00,000
⇒Average money saved by Sunil = INR 1, 52,000
∴Required ratio = ≈68%