Quantitative Aptitude - SPLessons

SSC CPO Data Interpretation Quiz 2

Home > > Tutorial
SPLessons 5 Steps, 3 Clicks
5 Steps - 3 Clicks

SSC CPO Data Interpretation Quiz 2

shape Introduction

Data Interpretation is the ability to analyze, interpret and visualize the provided data to arrive at conclusions and to make inferences. Data Interpretation questions in the competitive exams is a test of analytical abilities. In the competitive exams, the Data Interpretation questions are grouped together and refer to the same table, graph or other data/visual presentation. The test takers are required to interpret or analyze the given data to answer the questions. In India, competitive exams related to employment in Banking, SSC, Insurance, etc..have the Data Interpretation type of questions. The articleSSC CPO Data Interpretation Quiz 2 provides Data Interpretation Practice Quizzes with solutions. Candidates can check the updates at SSC Official Website.

shape Quiz

Directions (1-5): Study the following table and answer the questions that follow:

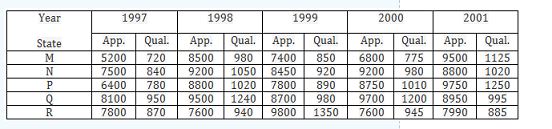
1. What is the percentage of candidates qualified from State N for all the years together, over the candidates appeared from State N during all the years together?
    A. 12.36% B. 12.16% C. 11.47% D. 11.15%

Answer: Option D
Explanation: Required Percentage =[latex]\frac{(840 + 1050 + 920 + 980 + 1020)}{(7500 + 9200 + 8450 + 9200 + 8800) * 100}[/latex] = [latex]\frac{4810}{43150} * 100[/latex] = 11.15%
2. What is the average of candidates who appeared from State Q during the given years?
    A. 8700 B. 8760 C. 8810 D. 8990

Answer: Option D
Explanation: [latex]\frac{(8100 + 9500 + 8700 + 9700 + 8950)}{15}[/latex] = [latex]\frac{44950}{5}[/latex]= 8990
3. Total number of candidates qualified from all the states together in 1997 is approximately what percentage of the total number of candidates qualified from all the states together in 1998?
    A. 72% B. 77% C. 80% D. 83%

Answer: Option C
Explanation: [latex]\frac{(720 + 840 + 780 + 950 + 870)}{(980 + 1050 + 1020 + 1240 + 940) * 100}[/latex]% = [latex]\frac{4160}{5230) * 100}[/latex]* 100 % = 79.54% = 80%
4. The percentage of the total number of qualified candidates to the total number of appeared candidates among all the five states in 1999 is:
    A. 11.49% B. 11.84% C. 12.21% D. 12.57%

Answer: Option B
Explanation: Required Percentage = [latex]\frac{(850 + 920 + 890 + 980 + 1350)}{(7400 + 8450 + 7800 + 8700 + 9800) * 100}[/latex]% = [latex]\frac{4990}{42150}[/latex]% = 11.84%
5. Combining the states P and Q together in 1998, what is the percentage of the candidates qualified to that of the candidates appeared?
    A. 10.87% B. 11.49% C. 12.35% D. 12.54%

Answer: Option C
Explanation: Required percentage = [latex]\frac{((1020 + 1240)}{(8800 + 9500) * 100}[/latex]% = ([latex]\frac{2260}{18300 * 100}[/latex]* 100)% = 12.35%
Direction (1-5): Study the following table to answer the 5 questions that are given below it.
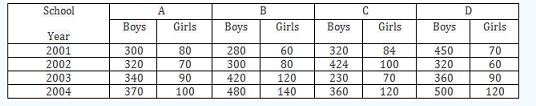
1. How many girls more participated in year 2004 as compared to 2003 for all schools taken together?
    A. 110 B. 370 C. 480 D. 210

Answer: Option A
Explanation: Number of girls participating in 2004 = 100 + 140 + 120 + 120 = 480 number of girls participants in 2003 = 90 + 120 + 70 + 90 = 370 required number = 480 - 370 = 110
2. The ratio of boys: girls for school B over the years 2001-2004 is
    A. 17:34 B. 14:37 C. 37:10 D. 34:17

Answer: Option C
Explanation: Number of boys participants for school B = 280 + 300 + 420 + 480 = 1480 number of girls participants for school B = 60 + 80 + 120 + 140 = 400 required ratio = 1480 : 400 = 37:10
3. The percentage increase in participation of boys from school B in 2004 over those in 2001 is nearly
    A. 28% B. 71% C. 72% D. 72%

Answer: Option B
Explanation: Number of boys participants in 2004 from school B = 480 Number of boys participants in 2001 from school B = 280 Percentage increase = [latex]\frac{(480 - 280)}{280}[/latex] * 100% = 71%
4. The total number of participants in year 2003 is
    A. 2000 B. 1830 C. 1720 D. 1640

Answer: Option C
Explanation: Number of participation in 2003 = (340 + 90) + (420 + 120) + (230 + 70) + (360 + 90) = 1720 = ([latex]\frac{495.4}{713.36}[/latex] * 100) % ˜ 69.45%
5. In year 2004 the number of participating girls is what percent of number of participating boys?
    A. 17:56 B. 56:17 C. 57:16 D. 16:57

Answer: Option D
Explanation: Number of girls participants in 2004 = 100 + 140 + 120 + 120 = 480 number of boys participants in 2004 = 370 + 480 + 360 + 500 = 1710 required ratio = 480 : 1710 = 16 : 57
Direction (1-5): Study the following table and answer the questions that follow:
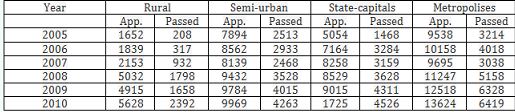
1. For the candidates from which of the following locations was there continuous increase both in appeared and passed?
    A semi-urban B State-capital C State-capital & Rural D None of those

Answer: Option D
Explanation: It is clear from visual inspection that there is no continuous increase both in appeared and passed in any location.
2. In which of the following years was the percentage qualified to appeared candidates from Semi-urban area the least?
    A. 2006 B. 2008 C. 1990 D. 2007

Answer: Option D
Explanation: Percentage of qualified to appeared candidates from Semi-urban area in 2005 = [latex]\frac{2513}{7894}[/latex]* 100 = 31.83% Percentage of qualified to appeared candidates from Semi-urban area in 2006 = [latex]\frac{2993}{8562}[/latex]* 100 = 34.25% Percentage of qualified to appeared candidates from Semi-urban area in 2007 = 2468/8139 * 100 = 30.32% Percentage of qualified to appeared candidates from Semi-urban area in 2008 = 3528/9432 * 100 = 37.40% Percentage of qualified to appeared candidates from Semi-urban area in 2009 = 4015/9784 * 100 = 41.03% Percentage of qualified to appeared candidates from Semi-urban area in 2010 = 4263/9969 * 100 = 42.76%
3. Approximately, what was the percentage drop in the number of Semi-urban candidates appeared from 2006 to 2007?
    A. 5 B. 10 C. 15 D. 8

Answer: Option A
Explanation: Required percentage = [latex]\frac{(8562 - 8139)}{8562}[/latex] * 100 = 4.94% = 5%
4. In 2008 the percentage of candidates qualified to appeared was approximately 35 from which location?
    A. Rural B. Rural and Metropolises C. Semi-urban and Metropolises D. Rural and Semi-urban

Answer: Option A
Explanation: In 2008 the percentage of candidates qualified to appeared in Rural area = [latex]\frac{1798}{50322}[/latex] * 100 = 35.73% In 2008 the percentage of candidates qualified to appeared in Semi-urban area = [latex]\frac{3528}{9432}[/latex] * 100 = 37.40% In 2008 the percentage of candidates qualified to appeared in State capital area = [latex]\frac{3628}{8529}[/latex] * 100 = 42.53% In 2008 the percentage of candidates qualified to appeared in Metropolises area = [latex]\frac{5138}{11247}[/latex] * 100 = 45.86% Therefore, the most appropriate answer is Rural area.
5. The total number of candidates qualified from Rural in 2008 and Semi-urban in 2005 was exactly equal to the total number of candidates qualified from State-capitals in which of the following years?
    A. 2005 B. 2008 C. 2009 D. 2007

Answer: Option C
Explanation: The number of candidates qualified from Rural area in 2008 = 1798 The number of candidates qualified from Semi-urban area in 2005 = 2513 Total sum = 1798 + 2513 = 4311 The number of candidates qualified from State-capitals in 2009 = 4311

Data Interpretation - Related Information
Data Interpretation Practice Sets for Competitive Exams
Quantitative Aptitude - Data Interpretation Practice sets
Important Data Interpretation Problems