Quantitative Aptitude - SPLessons

IBPS RRB Data Interpretation Quiz Day 1

Home > > Tutorial
SPLessons 5 Steps, 3 Clicks
5 Steps - 3 Clicks

IBPS RRB Data Interpretation Quiz Day 1

shape Introduction

Institute of Banking Personnel Selection (IBPS) has announced a notification for the recruitment of IBPS RRB Officer (Scale I, Scale II, Scale III). Candidates who are interested and meet all eligibility criteria can read the Official Notification issued by IBPS. IBPS RRB Online Examination – Preliminary Exam would be held on 03.08.2019, 04.08.2019 and 11.08.2019.
The article IBPS RRB Data Interpretation Quiz Day 1 provides Data Interpretation pattern Questions, and it helps the candidates to devise effective preparation strategies, by focusing on their strengths and weaknesses in different topics and also useful to the candidates while preparing Various Insurance, Banking & Government Exams like SBI PO, SBI Clerk, SSC CPO, SSC CHSL.

shape Quiz

A school has four sections A, B, C, D of Class IX students. The results of half yearly and annual examinations are shown in the table given below.
Result No. of Students
Section A Section B Section C Section D
Students failed in both Exams 28 23 17 27
Students failed in half-yearly but passed in Annual Exams 14 12 8 13
Students passed in half-yearly but failed in Annual Exams 6 17 9 15
Students passed in both Exams 64 55 46 76

1. If the number of students passing an examination be considered a criterion for comparison of the difficulty level of two examinations, which of the following statements is true in this context?
    A. Half yearly examinations were more difficult. B. Annual examinations were more difficult. C. Both the examinations had almost the same difficulty level. D. The two examinations cannot be compared for difficulty level.

Answer: Option C
Explanation: Number of students who passed half-yearly exams in the school = (Number of students passed in half-yearly but failed in annual exams) + (Number of students passed in both exams) = (6 + 17 + 9 + 15) + (64 + 55 + 46 + 76) = 288. Also, Number of students who passed annual exams in the school = (Number of students failed in half-yearly but passed in annual exams) + (Number of students passed in both exams) = (14 + 12 + 8 + 13) + (64 + 55 + 46 + 76) = 288. Since, the number of students passed in half-yearly = the number of students passed in annual exams. Therefore, it can be inferred that both the examinations had almost the same difficulty level.
2. How many students are there in Class IX in the school?
    A. 336 B. 189 C. 335 D. 430

Answer: Option D
Explanation: Since the classification of the students on the basis of their results and sections form independent groups, so the total number of students in the class: = (28 + 23 + 17 + 27 + 14 + 12 + 8 + 13 + 6 + 17 + 9 + 15 + 64 + 55 + 46 + 76) = 430.
3. Which section has the maximum pass percentage in at least one of the two examinations?
    A. A Section B. B Section C. C Section D. D Section

Answer: Option D
Explanation: Pass percentages in at least one of the two examinations for different sections are: For Section A [[latex]\frac{(14 + 6 + 64)}{(28 + 14 + 6 + 64)}[/latex] x 100] % = [[latex]\frac{84}{112}[/latex] x 100] % = 75%. For Section B [[latex]\frac{(12 + 17 + 55)}{(23 + 12 + 17 + 55)}[/latex] x 100] % = [[latex]\frac{84}{107}[/latex] x 100] % = 78.5%. For Section C [[latex]\frac{(8 + 9 + 46)}{(17 + 8 + 9 + 46)}[/latex] x 100] % = [[latex]\frac{63}{80}[/latex] x 100 ] % = 78.75%. For Section D [[latex]\frac{(13 + 15 + 76)}{(27 + 13 + 15 + 76)}[/latex] x 100] % = [[latex]\frac{104}{131}[/latex] x 100] % = 79.39%. Clearly, the pass percentage is maximum for Section D.
4. Which section has the maximum success rate in annual examination?
    A. A Section B. B Section C. C Section D. D Section

Answer: Option A
Explanation: Total number of students passed in annual exams in a section = [ (No. of students failed in half-yearly but passed in annual exams) + (No. of students passed in both exams) ] in that section Therefore Success rate in annual exams in Section A = [[latex]\frac{No. of students of Section A passed in annual exams}{Total number of students in Section A}[/latex] x 100] % = [[latex]\frac{(14 + 64)}{(28 + 14 + 6 + 64)}[/latex] x 100] % = [[latex]\frac{78}{112}[/latex] x 100] % = 69.64%. Similarly, success rate in annual exams in: Section B [[latex]\frac{(12 + 55)}{(23 + 12 + 17 + 55)}[/latex] x 100] % = [[latex]\frac{67}{107}[/latex] x 100] % = 62.62%. Section C [[latex]\frac{(8 + 46)}{(17 + 8 + 9 + 46)}[/latex] x 100] % = [[latex]\frac{54}{80}[/latex] x 100] % = 67.5%. Section D [[latex]\frac{(13 + 76)}{(27 + 13 + 15 + 76)}[/latex] x 100] % = [[latex]\frac{89}{131}[/latex] x 100] % = 67.94%. Clearly, the success rate in the annual examination is maximum for Section A.
5. Which section has the minimum failure rate in half yearly examination?
    A. A section B. B section C. C section D. D section

Answer: Option D
Explanation: Total number of failures in half-yearly exams in a section = [ (Number of students failed in both exams) + (Number of students failed in half-yearly but passed in Annual exams) ] in that section Therefore Failure rate in half-yearly exams in Section A = [[latex]\frac{Number of students of Section A failed in half-yearly}{Total number of students in Section A}[/latex] x 100] % = [[latex]\frac{(28 + 14)}{(28 + 14 + 6 + 64)}[/latex] x 100] % = [[latex]\frac{42}{112}[/latex] x 100] % = 37.5%. Similarly, failure rate in half-yearly exams in: Section B [[latex]\frac{(23 + 12)}{(23 + 12 + 17 + 55)}[/latex] x 100] % = [[latex]\frac{35}{107}[/latex] x 100] % = 32.71%. Section C [[latex]\frac{(17 + 8)}{(17 + 8 + 9 + 46)}[/latex] x 100] % = [[latex]\frac{25}{80}[/latex] x 100] % = 31.25%. Section D [[latex]\frac{(27 + 13)}{(27 + 13 + 15 + 76)}[/latex] x 100] % = [[latex]\frac{40}{131}[/latex] x 100] % = 30.53%. Clearly, the failure rate is minimum for Section D
Study the following line graph and answer the questions based on it.
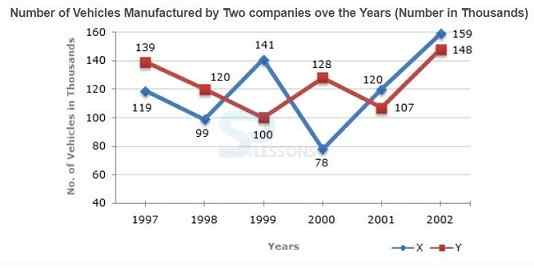
1. What is the difference between the number of vehicles manufactured by Company Y in 2000 and 2001 ?
    A. 50000 B. 42000 C. 33000 D. 21000

Answer: Option D
Explanation: Required difference = (128000 - 107000) = 21000.
2. What is the difference between the total productions of the two Companies in the given years ?
    A. 19000 B. 22000 C. 26000 D. 28000

Answer: Option C
Explanation: From the line-graph it is clear that the productions of Company X in the years 1997, 1998, 1999, 2000, 2001 and 2002 are 119000, 99000, 141000, 78000, 120000 and 159000 and those of Company Y are 139000, 120000,100000, 128000, 107000 and 148000 respectively. Total production of Company X from 1997 to 2002 = 119000 + 99000 + 141000 + 78000 + 120000 + 159000 = 716000. and total production of Company Y from 1997 to 2002 = 139000 + 120000 + 100000 + 128000 + 107000 + 148000 = 742000. Difference = (742000 - 716000) = 26000.
3. What is the average numbers of vehicles manufactured by Company X over the given period ? (rounded off to nearest integer)
    A. 119333 B. 113666 C. 112778 D. 111223

Answer: Option A
Explanation: Average number of vehicles manufactured by Company X = [latex]\frac{1}{6}[/latex] × (119000 + 99000 + 141000 + 78000 + 120000 + 159000) = 119333.
4. In which of the following years, the difference between the productions of Companies X and Y was the maximum among the given years ?
    A. 1997 B. 1998 C. 1999 D. 2000

Answer: Option D
Explanation: The difference between the productions of Companies X and Y in various years are: For 1997 (139000 - 119000) = 20000. For 1998 (120000 - 99000) = 21000. For 1999 (141000 - 100000) = 41000. For 2000 (128000 - 78000) = 50000. For 2001 (120000 - 107000) = 13000. For 2002 (159000 - 148000) = 11000. Clearly, the maximum difference was in 2000.
5. The production of Company Y in 2000 was approximately what percent of the production of Company X in the same year ?
    A. 173 B. 164 C. 132 D. 97

Answer: Option B
Explanation: Required percentage = (128000 × 100) % ≅ 164%. 78000
The bar graph given below shows the data of the production of paper (in lakh tonnes) by three different companies X, Y and Z over the years.
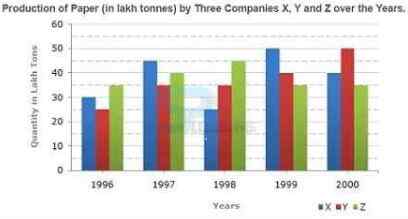
1. For which of the following years, the percentage rise/fall in production from the previous year is the maximum for Company Y?
    A. 1997 B. 1998 C. 1999 D. 2000

Answer: Option A
Explanation: Percentage change (rise/fall) in the production of Company Y in comparison to the previous year, for different years are: For 1997 = [[latex]\frac{(35 - 25)}{25}[/latex] × 100] % = 40%. For 1998 = [[latex]\frac{(35 - 35)}{35}[/latex] × 100] % = 0%. For 1999 = [[latex]\frac{(40 - 35)}{35}[/latex] × 100] % = 14.29%. For 2000 = [[latex]\frac{(50 - 40)}{40}[/latex] × 100] % = 25%. Hence, the maximum percentage rise/fall in the production of Company Y is for 1997.
2. What is the ratio of the average production of Company X in the period 1998-2000 to the average production of Company Y in the same period?
    A. 1:1 B. 15:17 C. 23:25 D. 27:29

Answer: Option C
Explanation: Average production of Company X in the period 1998-2000 = [[latex]\frac{1}{3}[/latex] × (25 + 50 + 40)] = ([latex]\frac{115}{3}[/latex]) lakh tons. Average production of Company Y in the period 1998-2000 = [[latex]\frac{1}{3}[/latex] × (35 + 40 + 50)] = ([latex]\frac{125}{3}[/latex]) lakh tons. Therefore Required ratio = [latex]\frac{\frac{115}{3} }{\frac{125}{3}}[/latex] = [latex]\frac{23}{25}[/latex]
3. The average production for five years was maximum for which company?
    A. X B. Y C. Z D. X and Z both

Answer: Option D
Explanation: Average production (in lakh tons) in five years for the three companies are: For Company X = [[latex]\frac{1}{5}[/latex] × (30 + 45 + 25 + 50 + 40)] = [latex]\frac{190}{5}[/latex] = 38. For Company Y = [[latex]\frac{1}{5}[/latex] × (25 + 35 + 35 + 40 + 50)] = [latex]\frac{185}{5}[/latex] = 37. For Company Z = [[latex]\frac{1}{5}[/latex] × (35 + 40 + 45 + 35 + 35)] = [latex]\frac{190}{5}[/latex] = 38. Therefore Average production of five years is maximum for both the Companies X and Z.
4. In which year was the percentage of production of Company Z to the production of Company Y the maximum?
    A. 1996 B. 1997 C. 1998 D. 1999

Answer: Option A
Explanation: The percentages of production of Company Z to the production of Company Z for various years are: For 1996 = ([latex]\frac{35}{25}[/latex] × 100) % = 140%. For 1997 = ([latex]\frac{40}{35}[/latex] × 100) % = 114.29%. For 1998 = ([latex]\frac{45}{35}[/latex] × 100) % = 128.57%. For 1999 = ([latex]\frac{35}{40}[/latex] × 100) % = 87.5%. For 2000 = ([latex]\frac{35}{50}[/latex] × 100) % = 70%. Clearly, this percentage is highest for 1996.
5. What is the percentage increase in the production of Company Y from 1996 to 1999?
    A. 30% B. 45% C. 50% D. 60%

Answer: Option D
Explanation: Percentage increase in the production of Company Y from 1996 to 1999 = [[latex]\frac{(40 - 25)}{25}[/latex] × 100] % = [[latex]\frac{15}{25}[/latex] × 100] % = 60%.

Other Articles

shape Exams

Competitive Exams - College Entrance Exams
Category Notification
Diploma NITC New Delhi
Click Here For – All India Entrance Exam Notifications


shape Job-Alerts

Competitive Exams - Recent Job Notifications
Category
Banking SSC Railway
Defence Police Insurance
Click Here For – All India Latest Jobs

shape SP Quiz

Competitive Exams - Practice Sets
Category Quiz
English Language Spotting Errors
Quant Aptitude Time and Work Quiz
Reasoning Ability Direction Sense
Insurance Awareness Insurance Awareness