Quantitative Aptitude - SPLessons

SSC CPO Data Interpretation Quiz 1

Home > > Tutorial
SPLessons 5 Steps, 3 Clicks
5 Steps - 3 Clicks

SSC CPO Data Interpretation Quiz 1

shape Introduction

Data Interpretation is the ability to analyze, interpret and visualize the provided data to arrive at conclusions and to make inferences. Data Interpretation questions in the competitive exams is a test of analytical abilities. In the competitive exams, the Data Interpretation questions are grouped together and refer to the same table, graph or other data/visual presentation. The test takers are required to interpret or analyze the given data to answer the questions. In India, competitive exams related to employment in Banking, SSC, Insurance, etc..have the Data Interpretation type of questions. The articleSSC CPO Data Interpretation Quiz 1 provides Data Interpretation Practice Quizzes with solutions.

shape Quiz

Directions (1-5): Pie chart shows the percent of money spent by family on various item during 1999. Study the graph and answer these questions.

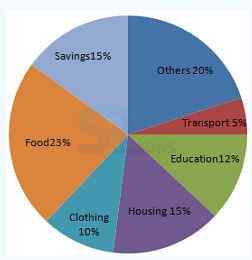
1. If the total amount spent during the year 1999 was Rs. 46000, the amount spent on food was :
    A. Rs. 2000 B. Rs. 10580 C. Rs. 23000 D. Rs. 2300

Answer: Option B
Explanation: Amount spent on food = Rs. [latex]\frac{23}{100 }[/latex] * 46,000) = Rs. 10,580.
2. If the total amount spent was Rs. 46,000, how much money was spent on clothing and housing together?
    A. Rs. 11500 B. Rs. 1150 C. Rs. 10000 D. Rs. 15000

Answer: Option A
Explanation: Amount spent on clothing and housing together = [latex]\frac{(10 + 15)}{100 }[/latex] * 46,000 = Rs. 11,500
3. The ratio of the total amount of money spent on housing to that spent on education was
    A. 5:2 B. 2:5 C. 4:5 D. 5:4

Answer: Option D
Explanation: Required ratio = 15 : 12 = 5:4
4. Graph shows that the maximum amount was spent on
    A. Food B. Housing C. Clothing D. Others

Answer: Option A
Explanation: As observed from the graph maximum amount was spent on food is 23%.
5. If the total expenditure of the family for the year 1999 was Rs. 46,000, the family saved during the year
    A. Rs. 1500 B. Rs. 15000 C. Rs. 6900 D. Rs. 3067 approx.

Answer: Option C
Explanation: Money saved = Rs. [latex]\frac{15}{100 }[/latex]* 46,000) = Rs. 6,900.
Direction (1-5): Study the following table to answer the 5 questions that are given below it.
Year Salary Fuel and Transport Bonus Interest on Loans Taxes
1998 288 98 3. 00 23. 4 83
1999 342 112 2.52 32.5 108
2000 324 101 3.84 41.6 74
2001 336 133 3.38 36.4 88
2002 420 142 3.96 49.4 98

1. The ratio between the total expenditure on taxes for all the years and the total expenditure on Fuel and Transport for all the years respectively is approximately:
    A. 4:7 B. 10:13 C. 15:18 D. 5:8

Answer: Option B
Explanation: Required Ratio = [latex]\frac{(83 + 108 + 74 + 88 + 98)}{(98 + 112 + 101 + 133 + 142) }[/latex] = 451/586 ≈ [latex]\frac{1}{1.3}[/latex] = [latex]\frac{10}{13}[/latex]
2. The total expenditure of the Company over these items during the year 2000 is
    A. Rs. 544.44 Lakhs B. Rs. 501.11 Lakhs C. Rs. 446.46 Lakhs D. Rs. 478.87 Lakhs

Answer: Option A
Explanation: Total expenditure of the Company during 2000 = Rs. (324 + 101 + 3.84 + 41.6 + 74) lakhs = Rs. 544.44 lakhs
3. What is the average amount of interest per year which the Company had to pay during this period?
    A. Rs. 32.43 lakhs B. Rs. 33.72 lakhs C. Rs. 34.18 lakhs D. Rs. 36.66 lakhs

Answer: Option D
Explanation: Average amount of interest paid by the Company during the given period = Rs. [[latex]\frac{(23.4 + 32.5 + 41.6 + 36.4 + 49.4)}{5}[/latex]] lakhs = Rs. ([latex]\frac{183.3}{5}[/latex]) lakhs = Rs. 36.66 lakhs.
4. Total expenditure on all these items in 1998 was approximately what percent of the total expenditure in 2002?
    A. 62% B. 66% C. 69% D. 71% E. 38%

Answer: Option C
Explanation: Required percentage = [[latex]\frac{(288 + 98 + 3.00 + 23.4 + 83)}{(420 + 142 + 3.96 + 49.4 + 98)}[/latex] * 100] % = ([latex]\frac{495.4}{713.36}[/latex] * 100) % ≈ 69.45%
5. The total amount of bonus paid by the Company during the given period is approximately what percent of the total amount of salary paid during this period?
    A. 0.1% B. 0.5% C. 1% D. 1.25%

Answer: Option C
Explanation: Required percentage = [[latex]\frac{(3.00 + 2.52 + 3.84 + 3.68 + 3.96)}{(288 + 342 + 324 + 336 + 420)}[/latex] * 100]% = ([latex]\frac{17}{1710}[/latex] * 100)% = 1%
Direction (1-5): Study the following table and answer the questions that follow:
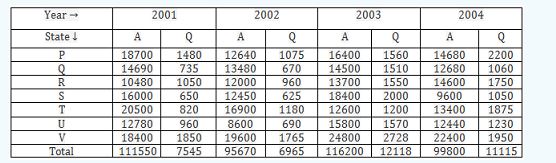
1. Which of the following states registered the maximum percentage of those qualified with respect to those appeared in 2003?
    A S B T C P D Q

Answer: Option D
Explanation: In the year 2003 Required % for P = [latex]\frac{1560}{16400}[/latex] * 100 = 9.5% Required % for Q =[latex]\frac{1570}{14500}[/latex] * 100 = 10.4% Required % for S = [latex]\frac{2000}{18400}[/latex] * 100 = 10.9% Required % for T = [latex]\frac{1200}{12600}[/latex] 1200/12600 * 100 = 9.5% State Q registers maximum percentage.
2. For which of the following years the percentage of candidates qualified with respect to those appeared for state V is the minimum?
    A. 2000 B. 2002 C. 2003 D. 2004

Answer: Option D
Explanation: Required % for 2001 = [latex]\frac{1850}{18400}[/latex]* 100% = 10.05% Required % for 2002 = [latex]\frac{1765}{19600}[/latex] * 100% = 9% Required % for 2003 = [latex]\frac{2728}{24800}[/latex] * 100% = 11% Required % for 2004 = [latex]\frac{1950}{22400}[/latex]* 100% = 8.7% Minimum percentage is in years 2004.
3. Which of the following state registered a continuous increase with respect to the previous year in the number of candidates qualified?
    A. P B. Q C. V D. T

Answer: Option D
Explanation: Only State T shows continuous increase in the number of qualified candidates.
4. What approximately is the average number of candidates qualified in 2004 from the given States?
    A. 1585 B. 1588 C. 1590 D. None of the above

Answer: Option B
Explanation: Required average = [latex]\frac{11115}{7}[/latex] ≈ 1588
5. What is the approximate average number of candidate, appeared from state Q every year?
    A. 14480 B. 14485 C. 14490 D. 15936

Answer: Option D
Explanation: Required average = [latex]\frac{111550}{7}[/latex]≈ 15936.

Data Interpretation - Related Information
Data Interpretation Practice Sets for Competitive Exams
Quantitative Aptitude - Data Interpretation Practice sets
Important Data Interpretation Problems