


 Introduction
Pie chart Problems or pie graph is a circle, divided into different segments representing the area of each segment.
- Given numerical values are represented in the form of sectors of a circle.
- The sectors of the circle are drawn in such a way that the area of each segment is proportional to the size of the figure to be represented.
- Degree of each component will be based on the proportional value it has to the whole circle.
- The values are represented in the pie diagram only with percentages and it makes comparison easy.
Quantitative Aptitude -BANKING|SSC|RAILWAYS|INSURANCE|RECRUITMENT EXAMS - EBOOKS
Methods
Formula 1:
sum of all central angles is [latex]{360}^{\circ}[/latex]. Then,
Central angle of the component = [latex](\frac{value of the component}{total value} * 360)^{\circ}[/latex]
Example 1:
How do you find the central angle of a pie chart for a section of the pie chart that represents 20% of the pie?
Solution:
- In any sector, there are 3 parts to be considered:
The arc length,
The sector area
The sector angle
They all represent the SAME fraction of the whole circle.
The arc length is a fraction of the circumference
The sector area is a fraction of the whole area
The sector angle is a fraction of 360°
If the sector is 20 % of the pie chart, then each of these parts is 20 % of the whole.
The sector angle is therefore:
20 % × 360°
[latex]\frac{20}{100}[/latex] x 360° = 72°
- The total angle that 320 value will cover in a pie chart is 80 degree.
We know that total angle is 360 degree.
Hence 360 degree corresponds to 1440 value
=> 320 value corresponds to = 360x 320/1440
= 80 degree
Formulae
The central angle of each sector must be proportional to the corresponding value of the component.
Since sum of all central angles is [latex]{360}^{\circ}[/latex]. Then,
Central angle of the component = [latex](\frac{value of the component}{total value} * 360)^{\circ}[/latex]
Samples
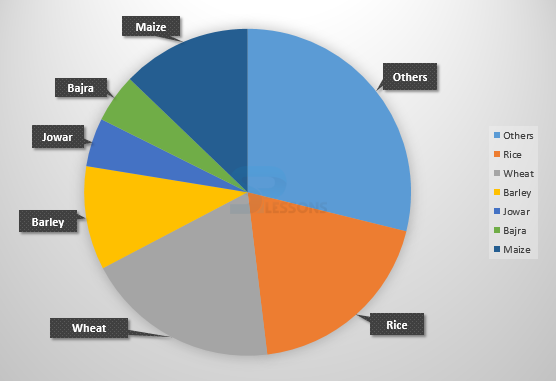
1. Distribution of land (in a village) under various food crops is provided in the below pie chart. Answer the following question.
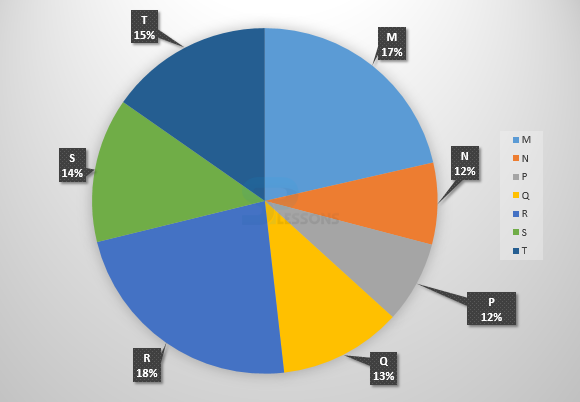 Total number of post-graduate level students = 24700
 1. What is the total number of graduate and post-graduate level students in institute R?
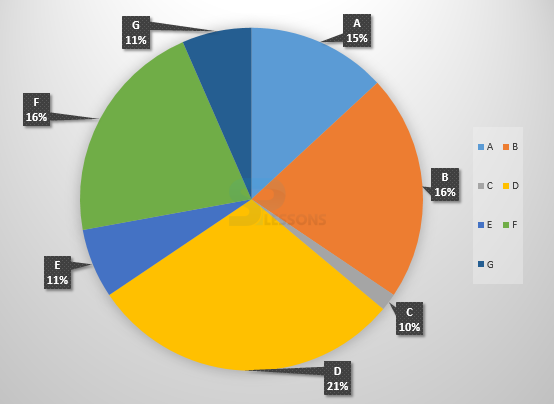
1. If the population of village F in 1997 is 32000, then what will be the population of village A below poverty line of that year?
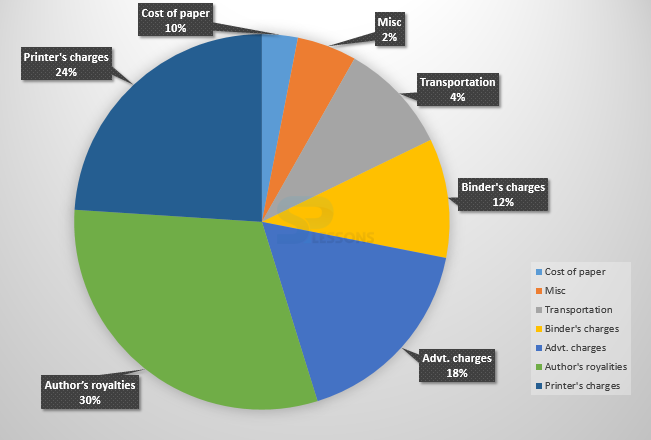 1. What should be the central angle of the sector for transportation charges?
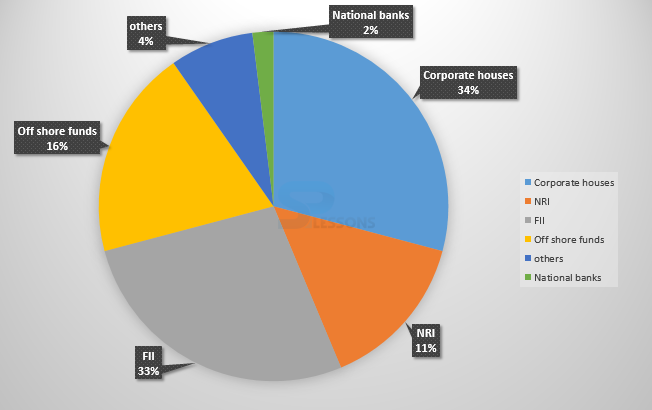 1. If the total investment other than by FII and corporate houses is Rs 3,35,000 crore, then what will be the investment by NRI's and Offshore funds (approximately)?
- Here, Others = 99°
Rice = 72°
Wheat = 72°
Barley = 36°
Jowar = 18°
Bajra = 18°
Maize = 45°
- (A) 33[latex]\frac{1}{3}[/latex]%
(B) 30%
(C) 35%
(D) 36%
- (A) Bajra, Maize and Rice.
(B) Rice, Wheat and Jowar.
(C) Rice, Wheat and Barley.
(D) Wheat, Barley and Jowar.
- (A) 4.5
(B) 9
(C) 7.5
(D) 6
- 1. Let Z acres of land be put under Barley production.
Then,
[latex]\frac{Area under rice production}{Area under barley production}[/latex] = [latex]\frac{72°}{36°}[/latex] = 2
Therefore,
Area under rice production = 2 x area under barley production = 2Z acres.
Now, if 'm' tonnes be the yield per acre of barley then, yield per acre of rice = (m + 50% of m) tonnes = [latex]\frac{3}{2}m[/latex] tonnes.
So, total production of rice = (yield per acre) x (area under production) = [latex]\frac{3}{2}m[/latex] x 2 Z = 3mZ tonnes.
And total production of barley = pZ tonnes.
Therefore, percentage production of barley to that of rice = [latex]\frac{m Z}{3 m Z} * 100[/latex]% = 33[latex]\frac{1}{3}[/latex]%
Therefore, option (A) is correct answer.
2. Total of the central angles for the given combinations are:
(i) Wheat, Barley and Jowar = (72° + 36° + 18°) = 126°
(ii) Rice, Wheat and Jowar = (72° + 72° + 18°) = 162°
(iii) Rice, Wheat and Barley = (72° + 72° + 36°) = 180°
(iv) Bajra, Maize and Rice = (18° + 45° + 72°) = 135°
Clearly, Rice, Wheat and Barley = 180° is required combination.
3. let the area under rice production be [latex]x[/latex] million acres.
Then, 18 : 72 = 1.5 : [latex]x[/latex]
[latex]x[/latex] = [latex]\frac{72 * 1.5}{18}[/latex]
[latex]x[/latex] = 6
Thus, the area under rice production = 6 million acres.
So, option (D) is the correct answer.
- (A) 8320
(B) 7916
(C) 9116
(D) 8372
- (A) 13 : 19
(B) 21 : 13
(C) 13 : 8
(D) 19 : 13
- (A) 7516
(B) 8463
(C) 9127
(D) 9404
- 1. Required number = (18% of 27300) + (14% of 24700) = 4914 + 3458 = 8372.
2. Required ratio = [latex]\frac{21% of 24700}{13% of 27300}[/latex] = [latex]\frac{21 * 24700}{13 * 27300}[/latex] = [latex]\frac{19}{13}[/latex]
3. Students of institute M at graduate level = 17% of 27300 = 4641.
Students of institute S at graduate level = 14% of 27300 = 3822.
Therefore,
Total number of students at graduate level in institutes M and S = 4641 + 3822 = 8463.
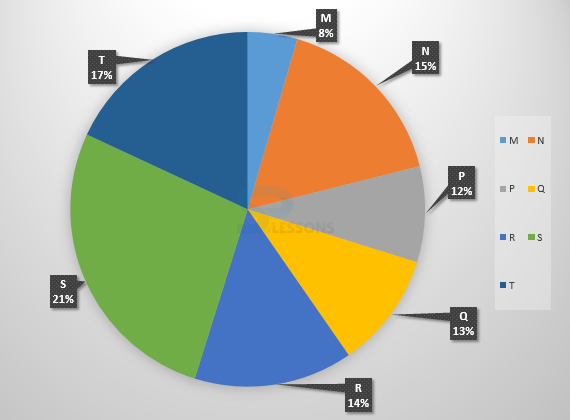
| Village | % Population below poverty line |
|---|---|
| A | 52 |
| B | 38 |
| C | 58 |
| D | 46 |
| E | 49 |
| F | 51 |
| G | 42 |
- (A) 14100
(B) 15600
(C) 16500
(D) 17000
- (A) 18500
(B) 20500
(C) 22000
(D) 26000
- (A) 11 : 23
(B) 13 : 11
(C) 23 : 11
(D) 11 : 13
- 1. Given that, Population of village F = 32000
Let the population of village A be [latex]y[/latex]
Then,
16 : 15 = 32000 : [latex]y[/latex]
⇒ [latex]y[/latex] = [latex]\frac{15 * 32000}{16}[/latex] = 30000
Therefore, population of village A below poverty line = 52% of 30000 = 15600.
So, option (B) is the correct answer.
2. Let the population of village B be [latex]x[/latex]
Then,
38% of [latex]x[/latex] = 12160
⇒ [latex]x[/latex] = [latex]\frac{12160 * 100}{38}[/latex] = 32000
Now, if p be the population of village E, then
16 : 11 = 32000 : p
⇒ p = [latex]\frac{11 * 32000}{16}[/latex] = 22000
3. Let N be the total population of all the seven villages.
Then, population of village D below poverty line = 46% of (21% of N)
Population of village G below poverty line = 42% of (11% of N)
Therefore, required ratio = [latex]\frac{46% of (21% of N)}{42% of (11% of N)}[/latex] = [latex]\frac{46 * 21}{42 * 11}[/latex] = [latex]\frac{23}{11}[/latex]
- (A) 4 degrees
(B) 8.4 degrees
(C) 12.4 degrees
(D) 14.4 degrees
(E) None of these.
- (A) 6,000
(B) 10,500
(C) 12,000
(D) 15,000
(E) None of these.
- 1. Central angle representing transportation charges of 4% = [latex]\frac{4}{100} * {360}^{\circ}[/latex] = [latex]{14.4}^{\circ}[/latex]
Hence, correct option is (D).
2.If the author's royalties is Rs. 30,000 which is 30% of total expenditure.
Therefore, total of publisher's expenditure = Rs. [latex]\frac{100}{30} * 30,000[/latex] = Rs. 1,00,000
Hence, Binder's charges = 12% of Rs. 1,00,000
= Rs. [latex]\frac{12}{100} * 1,00,000[/latex]
= Rs. 12,000.
Hence, option (C) is the correct answer.
- (A) 274,100
(B) 285,600
(C) 293,000
(D) Cannot be determined
- (A) 24,000 crore
(B) 24,363 crore
(C) 25,423 crore
(D) 25,643 crore
- (A) 40 %
(B) 50 %
(C) 60 %
(D) 70 %
- (A) 120
(B) 121
(C) 122
(D) 123
- 1. Investment other than NRI and corporate houses is 33% = 335000.
Also, investment by offshore funds and NRI's is equal to 27%.
Hence, 27 x [latex]\frac{335,000}{33}[/latex] = 274 090.909
So, option (A) is correct answer.
2. The investments by corporate houses and FII's together = [latex]\frac{67}{11}[/latex] x 4000 = 24 363.6364
Hence, option (B) is correct.
3. FII's currently account for 33 out of 100.
If their value is doubled and all other investments are kept constant then their new value would be 66 out of 133 = approximately equal to 50%
Hence, option (B) is correct answer.
4. 34 x 3.6 = 122.4 (since 1% = 3.6 degrees)
Therefore, 122.4 degrees should be there in the central angle.