Quantitative Aptitude - SPLessons

IBPS RRB Data Interpretation Quiz Day 2

Home > > Tutorial
SPLessons 5 Steps, 3 Clicks
5 Steps - 3 Clicks

IBPS RRB Data Interpretation Quiz Day 2

shape Introduction

Institute of Banking Personnel Selection (IBPS) has announced a notification for the recruitment of IBPS RRB Officers Scale II . Candidates who are interested and meet all eligibility criteria can read the Official Notification issued by IBPS. IBPS RRB Online Examination – Preliminary Exam would be held on 03.08.2019, 04.08.2019 and 11.08.2019.
The article IBPS RRB Data Interpretation Quiz Day 2 provides Data Interpretation pattern Questions, and it helps the candidates to devise effective preparation strategies, by focusing on their strengths and weaknesses in different topics and also useful to the candidates while preparing Various Insurance, Banking & Government Exams like SBI PO, SBI Clerk, SSC CPO, SSC CHSL.

shape Quiz

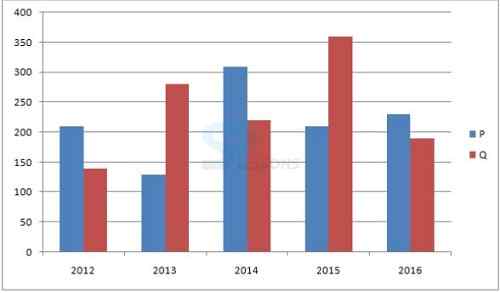
(Q.no: 1-5 ) Refer to the following Bhar Graph and Table then answer given questions.

University 2012 2013 2014 2015 2016
P 210 130 310 210 230
Q 140 280 220 360 190

1. In 2013, out of the total number of applications received for Universities P and Q together, only 30% were accepted. What was the total number of applications accepted for Universities P and Q together in 2013?
    A. 132 B. 135 C. 141 D. 123 E. None of the Above

Answer: Option D
Explanation : Total number of applications accepted by P and Q together in 2013 = (130 + 280) × [latex]\frac{30}{100}[/latex] =123
2. In 2012, 30% of applications received for University P and 20% of applications received for University Q were from international students. What was the total number of International applicants for University P and Q together in 2012?
    A. 91 B. 97 C. 89 D. 93 E. 87

Answer: Option A
Explanation : Total Number of International applicants for University P and Q together = 210 × [latex]\frac{30}{100}[/latex] + 140 × [latex]\frac{20}{100}[/latex] = 63 + 28 = 91
3. If the respective ratio of total number of applications received for University P and Q together in 2016 and 2017 is 3:4. What was the total number of applications received for University P and Q together in 2017?
    A. 456 B. 560 C. 540 D. 530 E. None of the Above

Answer: Option B
Explanation : Total number of applications received for Universities P and Q together in 2016 = 230 + 190 = 420 Total number of applications received for Universities P and Q together in 2017 = 420 × [latex]\frac{4}{3}[/latex] = 560
4. What is the average number of applications received for University P in 2013, 2015 and 2016?
    A. 190 B. 180 C. 170 D. 200 E. 160

Answer: Option A
Explanation : Average number of applications received for University A in 2013, 2015 and 2016 = [latex]\frac{(130 + 210 + 230)}{3}[/latex] = 190
5. Number of applications received for University Q increased by what percent from 2012 to 2014?
    A. [latex]\frac{100}{7}[/latex]% B. [latex]\frac{200}{7}[/latex]% C. [latex]\frac{300}{7}[/latex]% D. [latex]\frac{400}{7}[/latex]% E. None of these

Answer: Option D
Explanation : % = [latex]\frac{(200 - 140 )}{140}[/latex] × 100 = [latex]\frac{400}{7}[/latex] %
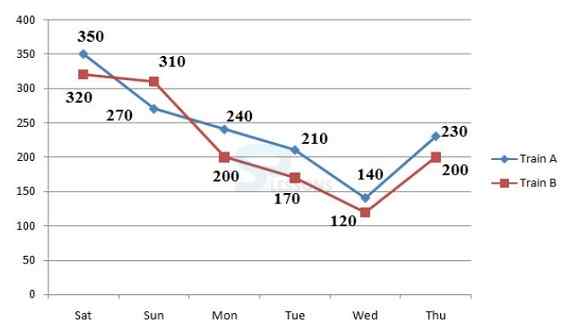
(Q.no: 1-5). Refer to the following Line Graph and answer the given questions.
1. The number of people who traveled by Train B on Friday is 30% more than the people who traveled by the same train on Thursday. What is the respective ratio between the number of people who traveled on Friday and those who traveled on Saturday by the same train?
    A. 14 : 15 B. 13 : 14 C. 15 : 16 D. 13 : 14 E. 13 : 16

Answer: Option E
Explanation: 30% of 200 = 60 People traveled by Train B on Friday = 260 260 : 320 = 13 : 16
2. What is the difference between the total number of people who traveled by Train B on Saturday and Sunday together and the total number of people who traveled by Train A on Saturday and Sunday together?
    A. 20 B. 30 C. 10 D. 50 E. 40

Answer: Option C
Explanation: Train B on Saturday and Sunday together = 320 + 310 = 630 Train A on Saturday and Sunday together = 350 + 270 = 620 Difference = 630 – 620 = 10
3. What is the average number of people traveling by Train B on Monday, Tuesday, Wednesday and Thursday?
    A. 160.5 B. 130.5 C. 172.5 D. 165.5 E. 164.5

Answer: Option C
Explanation: 200 + 170 + 120 + 200 = 172.5
4. The number of people who traveled by Train A decreased by what percent from Saturday to Wednesday?
    A. 30% B. 60% C. 30% D. 42% E. 33%

Answer: Option B
Explanation: [[latex]\frac{(350 – 140)}{350}[/latex] ] × 100 = [[latex]\frac{210}{350}[/latex] ] × 100 = 60%
5. The total number of people who traveled by both the given trains together on Monday is approximately what percent more than the total number of people who traveled by both the given trains together on Wednesday?
    A. 68% B. 63% C. 62% D. 69% E. 65%

Answer: Option D
Explanation: [latex]\frac{(440 – 260)}{260}[/latex] × 100 = [latex]\frac{180}{260}[/latex] × 100 = 69%
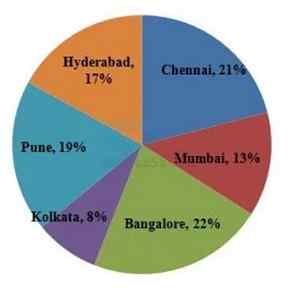
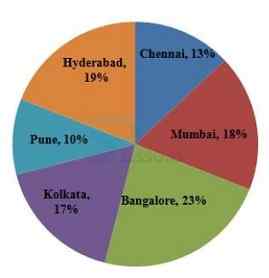
Study the following Pie charts carefully to answer the given Questions
Percentage of students from differentcities attending an interview,Total Students = 9000
Percentage of female students from different cities attending an interview, Total Female students = 3500
1. What is the total number of male students from Chennai and Bangalore together?
    A. 2530 B. 2720 C. 2610 D. 2480 E. None of these

Answer: Option C
Explanation: Number of male students from Chennai= [latex]\frac{21}{100}[/latex] × 9000 – [latex]\frac{13}{100}[/latex] × 3500 = 1890 – 455 = 1435 Number of male students from Bangalore= [latex]\frac{22}{100}[/latex] × 9000 – [latex]\frac{23}{100}[/latex] × 3500 = 1980-805 = 1175 Total = 1435+1175 = 2610
2. What is the respective ratio between the number of female students from Mumbai to the number of male students from the same?
    A. 6 : 7 B. 4 : 7 C. 7 : 6 D. 2 : 7 E. None of these

Answer: Option C
Explanation: Number of female students from Mumbai = 630 Number of male students from Mumbai = 540 Ratio = [latex]\frac{630}{540}[/latex] = 7:6
3. From how many cities the number of female students is more than the number of male students?
    A. One B. Two C. Three D. Four E. More than four

Answer: Option B
Explanation: In Mumbai and Kolkata cities the number of female students is more than the number of male students.
4. What is the respective ratio between the total number of female students from Mumbai and Pune to the total number of male students from the same?
    A. 7 : 34 B. 39 : 65 C. 49 : 95 D. 69 : 133 E. None of these

Answer: Option C
Explanation: The total number of female students from Mumbai and Pune = 630+350= 980 The total number of male students from Mumbai and Pune = 540+1360 = 1900 Ratio = 980 : 1900 = 49 : 95
5. The number of female students from Hyderabadis approximately what percent of the male students from the same state?
    A. 54 B. 68 C. 77 D. 69 E. 56

Answer: Option C
Explanation: The number of female students from Hyderabad = 665 The number of male students from Hyderabad = 865 Percentage = [latex]\frac{665}{865}[/latex] × 100 = 77 approx.

Other Articles

shape Exams

Competitive Exams - College Entrance Exams
Category Notification
Diploma NITC New Delhi
PG GATE 2020
Click Here For – All India Entrance Exam Notifications


shape Job-Alerts

Competitive Exams - Recent Job Notifications
Category
Banking SSC Railway
Defence Police Insurance
Click Here For – All India Latest Jobs

shape SP Quiz

Competitive Exams - Practice Sets
Category Quiz
English Language Spotting Errors
Quant Aptitude Mensuration
Reasoning Ability Direction Sense
Insurance Awareness Insurance Awareness

shape GK

General Knowledge for Competitive Examinations
Topic Name of the Article
GK - World World Food Festivals
Signs and Symbols
GK - India Medieval History
Nick Names of Cities
GK - Abbreviations Insurance Domain Abbreviations
Indian Government Policies
GK - Banking & Insurance Negotiable Instruments
Indian Banks Association
GK - Science & Technology Human Body Facts
Father of Different Fields