Quantitative Aptitude - SPLessons

IBPS RRB Data Interpretation Quiz 1

Home > > Tutorial
SPLessons 5 Steps, 3 Clicks
5 Steps - 3 Clicks

IBPS RRB Data Interpretation Quiz 1

shape Introduction

Data Interpretation is the ability to analyze, interpret and visualize the provided data to arrive at conclusions and to make inferences. Data Interpretation questions in the competitive exams is a test of analytical abilities. In the competitive exams, the Data Interpretation questions are grouped together and refer to the same table, graph or other data/visual presentation. The test takers are required to interpret or analyze the given data to answer the questions. In India, competitive exams related to employment in Banking, SSC, Insurance, etc..have the Data Interpretation type of questions. The article IBPS RRB Data Interpretation Quiz 1 provides Data Interpretation Practice Quizzes with solutions.

shape Quiz

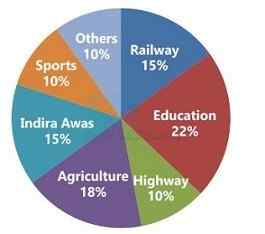
The given pie chart shows the spending by Indian Government on various fields during years 2014 and 2015.
Total spent by Government in 2014 = 5940 lakh crores Percentage spending of different fields in 2014

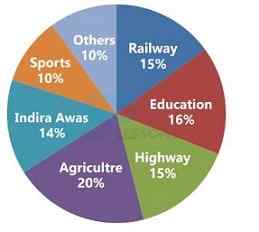
Total spent by Government in 2015 = 6720 lakh crores Percentage spending of different fields in 2015

1. What is the difference between total spending on Agriculture, Indira was and sports in 2015 and total spending on Railway, Education, and Highway in 2014?
    A. 150 lakh crores B. 155 lakh crores C. 160 lakh crores D. 165 lakh crores E. None of these

Answer:Option D
Explanation: Spending on Agri. in 2015 = [latex]\frac{6720 × 20}{100}[/latex] = 1344 Spending on Indira awas in 2015 = [latex]\frac{6720 × 14}{100}[/latex] = 940.8 Spending on Sports in 2015 = [latex]\frac{6720 × 10}{100}[/latex] = 672 Total spending on Agriculture, Indira awas and sports in 2015 = 1344 + 940.8 + 672 = 2956.8 lakh crores Spending on railway in 2014 = [latex]\frac{5940 × 15}{100}[/latex] = 891 Spending on Education in 2014 = [latex]\frac{5940 × 22}{100}[/latex] = 1306.8 Spending on Highway in 2014 = [latex]\frac{5940 × 10}{100}[/latex] = 594 Total spending on Railway, Education and Highway in 2014 = 891 + 1306.8 + 594 = 2791.8 lakh crores Hence, required difference = 2956.8 – 2791.8 = 165 lakh crores
2. What is the ratio of difference between Education field and Railway field in 2014 to difference between Highway and Indira awas in 2015?
    A. 16 : 99 B. 99 : 16 C. 16 : 97 D. 97 : 16 E. None of these

Answer:Option B
Explanation: Spending on Education in 2014 = [latex]\frac{5940 × 22}{100}[/latex] = 1306.8 Spending on Railway in 2014 = [latex]\frac{5940 × 15}{100}[/latex] = 891 Difference = 1306.8 – 891 = 415.8 Spending on Highway in 2015 = [latex]\frac{6720 × 15}{100}[/latex] = 1008 Spending on Indra awas in 2015 = [latex]\frac{6720 × 14}{100}[/latex] = 940.8 Difference = 1008 – 940.8 = 67.2 lakh crores Hence, required ratio = [latex]\frac{415.8}{67.2}[/latex] = 99 : 16
3. What is the percentage of spending in Indira was and Others together in both years to the percentage of spending in Education and Highway together in both years?
    A. 70.50% B. 77.10% C. 77.75% D. 75.75% E. None of these

Answer:Option C
Explanation: Spent in Indira awas in 2014 = [latex]\frac{5940 × 15}{100}[/latex] = 891 Spent in Indira awas in 2015 = [latex]\frac{6720 × 14}{100}[/latex] = 940.8 Spent in Others in 2014 = [latex]\frac{5940 × 10}{100}[/latex] = 594 Spent in others in 2015 = [latex]\frac{6720 × 10}{100}[/latex] = 672 Total amount spent in Indira awas and others together in both years = 891 + 940.8 + 594 + 672 = 3097.8 lakh crores Spent in Education in 2014 = [latex]\frac{5940 × 22}{100}[/latex] = 1306.8 lakh crores Spent in Education in 2015 = [latex]\frac{6720 × 16}{100}[/latex] = 1075.2 lakh crores Spent in Highway in 2014 = [latex]\frac{5940 × 10}{100}[/latex] = 594 lakh crores Spent in Highway in 2015 = [latex]\frac{6720 × 15}{100}[/latex] = 1008 Total amount spent in Education and Highway together in both years = 1306.8 + 1075.2 + 594 + 1008 = 3984 lakh crores Hence, required percentage = 3097.8 × 100 = 77.75% 3984
4. What is the ratio of spending in the education field and Railway field together in 2014 to spending in Highway and Agriculture together in 2015?
    A. 3663: 3920 B. 3920: 3663 C. 1307: 1221 D. 1221: 1307 E. None of these

Answer:Option A
Explanation: Spent in Education in 2014 = [latex]\frac{5940 × 22}{100}[/latex] = 1306.8 Spent in Railway in 2014 = [latex]\frac{5940 × 15}{100}[/latex] = 891 Total spent in Education and Railway together in 2014 = 1306.8 + 891 = 2197.8 lakh crores Spent in Highway in 2015 = [latex]\frac{6720 × 15}{100}[/latex] = 1008 Spent in Agriculture in 2015 = [latex]\frac{6720 × 20}{100}[/latex] = 1344 Total spent in Highway and Agriculture together in 2015 = 1008 + 1344 = 2352 lakh crores Hence, required ratio = [latex]\frac{2197.8}{2352}[/latex] = 3663 : 3920
5. In which field Percentage of spending had increases maximum from 2014 to 2015?
    A. Railway B. Education C. Highway D. Sports E. None of these

Answer:Option C
Explanation: Spent on Railway in 2014 = [latex]\frac{5940 × 15}{100}[/latex] = 891 Spent on Railway in 2015 = [latex]\frac{6720 × 15}{100}[/latex] = 1008 Percentage increase = [latex]\frac{1008 – 891}{100}[/latex] = 13.13% Spent on Education in 2014 = [latex]\frac{5940 × 22}{100}[/latex] = 1306.8 Spent on Education in 2015 = [latex]\frac{6720 × 16}{100}[/latex] = 1075.2 Percentage decrease = [latex]\frac{1306.8 – 1075.2}{1306.8}[/latex] = 17.72% Spent on Highway in 2014 = [latex]\frac{5940 × 10}{100}[/latex] = 594 Spent on Highway in 2015 = [latex]\frac{6720 × 15}{100}[/latex] = 1008 Percentage increase = [latex]\frac{1008 – 594}{594}[/latex] = 69.7% Spent on Agriculture in 2014 = [latex]\frac{5940 × 18}{100}[/latex] = 1069.20 Spent on Agriculture in 2015 = [latex]\frac{6720 × 10}{100}[/latex] = 1344 Percentage increase = [latex]\frac{1344 – 1069.2}{1069.2}[/latex] = 25.7% Spent on Indira awas in 2014 = [latex]\frac{5940 × 15}{100}[/latex] = 891 Spent on Indira awas in 2015 = [latex]\frac{6720 × 14}{100}[/latex] = 940.8 Percentage increase = [latex]\frac{940.8 – 891}{891}[/latex] = 5.58% Spent on Sports in 2014 = [latex]\frac{5940 × 10}{100}[/latex] = 594 Spent on Sports in 2015 =[latex]\frac{ 6720 × 10}{100}[/latex] = 672 Percentage increase = [latex]\frac{672 – 594}{594}[/latex] = 13.13% Spent on Others in 2014 = [latex]\frac{5940 × 10}{100}[/latex] = 594 Spent on Others in 2015 = [latex]\frac{6720 × 10}{100}[/latex] = 672 Percentage increase = [latex]\frac{672 – 594}{594}[/latex] = 13.13% Hence, the maximum percentage increase in Highway field from 2014 to 2015
Directions: Study the table and answer the given questions.
Number of pendants sold by 5 stores during 5 months
Month Store
A B C D E
May 128 79 154 84 74
June 154 111 87 113 89
July 181 132 113 96 121
August 158 145 241 138 164
September 135 118 129 99 165

1. The number of pendants sold by Store D increased by what per cent from May to August?
    A. 62 [latex]\frac{6}{7}[/latex] B. 58 [latex]\frac{2}{7}[/latex] C. 64 [latex]\frac{2}{7}[/latex] D. 68 [latex]\frac{4}{7}[/latex] E. 56 [latex]\frac{4}{7}[/latex]

Answer:Option C
Explanation: No. of pendants sold by Store D in May = 84 No. of pendants sold by Store D in August = 138 Reqd % Increase = [latex]\frac{138 – 84}{84}[/latex] × 100 = [latex]\frac{5400}{84}[/latex] = 64 [latex]\frac{2}{7}[/latex] %
2. Out of the total number of pendants sold by Store E in July, August and September together, 32% were made of silver. What was the total number silver pendants sold by Store E in July, August and September together?
    A. 148 B. 144 C. 152 D. 136 E. None of these

Answer:Option B
Explanation: Total no. of pendants sold by Store E in July, August and September together = 121 + 164 + 165 = 450 Given, 32% of pendants were made of Silver. ∴ Total no. of Silver pendants = 32% of 450 = [latex]\frac{32 × 450}{100}[/latex] = 144
3. What is the average number of pendants sold by Store A, D and E in June? (Approximate)
    A. 126 B. 118 C. 124 D. 116 E. 122

Answer:Option B
Explanation: Reqd avg = [latex]\frac{154 + 113 + 89}{3}[/latex] = [latex]\frac{356}{3}[/latex] = 118.66 ≈ 118
4. What is the ratio of the total number pendants sold by Store A and C in July to the total number of pendants sold by the same stores in August?
    A. 12 : 17 B. 12 : 19 C. 14 : 17 D. 14 : 19 E. 16 : 19

Answer:Option D
Explanation: Total no. pendants sold by Store A and C in July = 181 + 113 = 294 Total no. pendants sold by Store A and C in August = 158 + 241 = 399 Reqd ratio = [latex]\frac{294}{399}[/latex] = [latex]\frac{98}{133}[/latex] = 14 : 19
5. What is the difference between the total number pendants sold by Store B in May and September together and the total number of pendants sold by Store C in the same months together?
    A. 96 B. 78 C. 108 D. 86 E. 94

Answer:Option D
Explanation: Total no. of pedants sold by Store B in May and September together = 79 + 118 = 197 Total no. of pendants sold by Store C in May and September = 154 + 129 = 283 Reqd difference = 283 – 197 = 86
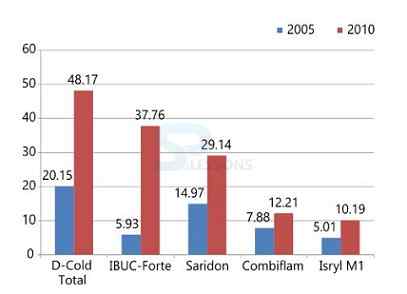
Directions: A pharmaceutical company provides five different products. The sales of these give products (in lakh number of packs) during 2005 and 2010 are shown in the following graph.
Sales (in lakh number of packs) of five different products of pharmaceutical company during 2005 and 2010
1. The sales of D-Cold Total in 2010 was by what percent more than the sales of IBUC-Forte in 2010? (rounded off to nearest integer)
    A. 33% B. 31% C. 28% D. 22% E. None of these

Answer:Option C
Explanation: Sales of D-Cold Total in 2010 = 48.17 lakh And sales of IBUC-Forte in 2010 = 37.76 lakh ∴ Required percentage = [latex]\frac{(48.17 – 37.76)}{37.76}[/latex] × 100% = 27.57% ≈ 28%
2. During the period 2005-2010, then the minimum rate of increasing sales in the case of
    A. Combiflam B. IBUC-Forte C. Saridon D. D-Cold Total E. None of these

Answer:Option A
Explanation: By just visual observation, we can see that the sale of Combiflam is getting increase by 4 (in approximation) with base of 8 (in approximation) Therefore, % increase in sales of Combiflam = [latex]\frac{4}{8}[/latex] × 100% = 50% Note: Sales of all the other products, on the other hand, show a percentage increase which is quite far from 50%.
3. What is the approximate ratio of the sales of IBUC-Forte in 2010 to the sale of Saridon in 2005?
    A. 7 : 2 B. 5 : 2 C. 4 : 3 D. 2 : 1 E. None of these

Answer:Option B
Explanation: Reqd ratio = Sales of IBUC-Forte in 2010 Sales of Saridon in 2005 = [latex]\frac{37.76}{14.97}[/latex] = 5 : 2
4. The sales have increased by nearly 55% from 2005 to 2010 in the case of
    A. D-Cold Total B. IBUC-Forte C. Saridon D. Combiflam E. None of these

Answer:Option A
Explanation: By just visual observation, we can see that the sale of Combiflam is getting increase by 4 (in approximation) with base of 8 (in approximation) Therefore, % increase in sales of Combiflam = [latex]\frac{4}{8}[/latex] × 100% = 50% ≈ 55% Note: Sales of all other products, on the other hand, show a percentage increase which is quite far from 55%.
5. The sales of Isryl M1 in 2005 was by what percent less than the sales of Combiflam in 2005? (rounded off to nearest integer)
    A. 57% B. 36% C. 29% D. 25% E. None of these

Answer:Option B
Explanation: Required % = [latex]\frac{7.88 – 5.01}{7.88}[/latex] × 100% = 36.42% ≈ 36%

Data Interpretation - Related Information
Data Interpretation Practice Sets for Competitive Exams
Data Interpretation Practice Set 1
Data Interpretation Practice Set 2
Book for Quantitative Aptitude