Quantitative Aptitude - SPLessons

IBPS PO Mains Data Analysis and Interpretation Quiz 1

Home > > Tutorial
SPLessons 5 Steps, 3 Clicks
5 Steps - 3 Clicks

IBPS PO Mains Data Analysis and Interpretation Quiz 1

shape Introduction

Data Interpretation is the ability to analyse, interpret and visualise the provided data to arrive at conclusions and to make inferences. Data Interpretation questions in the competitive exams is a test of analytical abilities. In the competitive exams, the Data Interpretation questions are grouped together and refer to the same table, graph or other data/visual presentation. The test takers are required to interpret or analyse the given data to answer the questions. In India, competitive exams related to employment in Banking, SSC, Insurance, etc..have the Data Interpretation type of questions. The article IBPS PO Mains Data Analysis and Interpretation Quiz 1 provides Data Interpretation Practice Quizzes with solutions.

shape Quiz

Directions (1-5): Study the following line chart carefully and answer the questions given beside.
The following line graph gives information about the percentage increase in the turnover of four companies (Patanjali, Reliance, Airtel, and Accenture) during the year 2012 to 2017 with respect to the previous year.

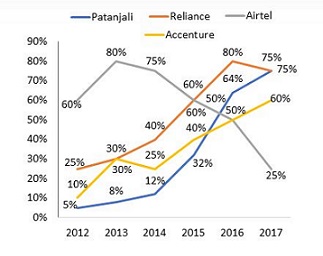
1. If at the end of the year 2011, the turnover of Patanjali was 25% less than the turnover of Airtel then at the end of 2014, the turnover of Patanjali was how much percent less than the turnover of Airtel? (approximately)
    A. 40% B. 60% C. 51% D. 81% E. 85%

Answer: Option D
Explanation: At the end of 2011, the respective ratio of the turnover of Patanjali and Airtel = 3 : 4 (the turnover of Patanjali was 25% less than the turnover of Airtel)
Let us assume that the turnover of Patanjali at the end of 2011 = 3x and the turnover of Airtel at the end of 2011 = 4x
Then, the turnover of Patanjali at the end of 2014
= 3x × [latex]\frac{105}{100}[/latex] × [latex]\frac{108}{100}[/latex] × [latex]\frac{112}{100}[/latex] = approximatley 3.81x
The turnover of Airtel at the end of 2014
= 4x × [latex]\frac{160}{100}[/latex] × [latex]\frac{180}{100}[/latex] × [latex]\frac{175}{100}[/latex] = 20.16x
The reqd. % = [latex]\frac{(20.16x – 3.81x) }{20.16x}[/latex] × 100 = approximately 81%
2. If at the end of 2015, the turnover of Patanjali was 75% of the turnover of Airtel, turnover of Airtel was 60% of the turnover of Accenture and the turnover of Accenture was 80% of the turnover of Reliance. If it is given that the turnover of Reliance at the end of 2015 was $ 1.75 billion. Then what was the sum of the total turnover of all the companies together at the end of 2017? (round off two decimal)
    A. $ 12.25 billion B. $ 14.21 billion C. $ 7.48 billion D. $ 9.64 billion E. $ 6.14 billion

Answer: Option A
Explanation: At the end of 2015, Let the turnover of Airtel = 4x then the turnover of Patanjali = 75% of 4x = 3x. turnover of Airtel was 60% of the turnover of Accenture, 60% of accenture’s turnover = 4x
Accenture’s turnover = 4x × [latex]\frac{100 }{60}[/latex] = [latex]\frac{20x }{3}[/latex] similarly,
Reliance’s turnover = ( [latex]\frac{\frac{20x}{3}}{80}[/latex] ) × 100 = [latex]\frac{25x }{3}[/latex]
According to the question,
25x = [latex]\frac{1.75 }{3}[/latex]
X = 0.21
At the end of 2017,
the turnover of airtel = 4x × [latex]\frac{150 }{100}[/latex] × [latex]\frac{125 }{100}[/latex] = 7.5x
the turnover of Patanjali = 3x × [latex]\frac{ 164 }{100}[/latex] × [latex]\frac{ 175 }{100}[/latex] = 8.61x
the turnover of Accenture = [latex]\frac{20x }{3}[/latex] × [latex]\frac{150 }{100}[/latex] × [latex]\frac{160 }{100}[/latex] = 16x
the turnover of Reliance = [latex]\frac{25x }{3}[/latex] × [latex]\frac{180 }{100}[/latex] × [latex]\frac{175 }{100}[/latex] = 26.25x
Required sum = 7.5x + 8.61x + 16x + 26.25x = 58.36x = 58.36 × 0.21 = 12.2556 billion
3. If the total turnover of Patanjali at the end of 2012 was $ 1 billion then find the total turnover of Patanjali at the end of 2017? (round off two decimal)
    A. $ 6.21 billion B. $ 7.21 billion C. $ 4.58 billion D. $ 3.12 billion E. $ 2.24 billion

Answer: Option C
Explanation: the total turnover of Patanjali at the end of 2017
= 1 × [latex]\frac{108 }{100}[/latex] × [latex]\frac{112 }{100}[/latex] × [latex]\frac{132 }{100}[/latex] × [latex]\frac{164 }{100}[/latex] × [latex]\frac{175 }{100}[/latex] = $ 4.58 billion approximately
4. At the end of 2012, the respective ratio of the turnover of Patanjali, Reliance, Airtel, and Accenture was 2: 7: 4: 5 then what was the respective ratio of the turnover of all the companies at the end of 2011?
    A. [latex]\frac{40}{21}[/latex] : [latex]\frac{28}{5}[/latex] : [latex]\frac{7}{2}[/latex] : [latex]\frac{50}{11}[/latex] B. [latex]\frac{40}{21}[/latex] : [latex]\frac{27}{5}[/latex] : [latex]\frac{5}{2}[/latex] : [latex]\frac{50}{11}[/latex] C. [latex]\frac{40}{21}[/latex] : [latex]\frac{28}{5}[/latex] : [latex]\frac{5}{2}[/latex] : [latex]\frac{40}{11}[/latex] D. [latex]\frac{20}{21}[/latex] : [latex]\frac{14}{5}[/latex] : [latex]\frac{5}{4}[/latex] : [latex]\frac{25}{11}[/latex] E. None of these

Answer: Option D
Explanation: Let at the end of 2011, the respective ratio of the turnover of Patanjali, Reliance, Airtel, and Accenture = A : B : C : D
Then, 105% of A = 2x
A = [latex]\frac{40x }{21}[/latex]
For Reliance, 125% of B = 7x
B = [latex]\frac{28x }{5}[/latex]
For Airtel, 160% of C = 4x
C = [latex]\frac{5x }{2}[/latex]
For Accenture, 110% of D = 5x
D = [latex]\frac{50x }{11}[/latex]
The reqd. ratio = [latex]\frac{40x }{21}[/latex] : [latex]\frac{28x }{5}[/latex] : [latex]\frac{5x }{2}[/latex] : [latex]\frac{50x }{11}[/latex]
= [latex]\frac{40 }{21}[/latex] : [latex]\frac{28 }{5}[/latex] : [latex]\frac{5 }{2}[/latex] : [latex]\frac{50 }{11}[/latex]
= [latex]\frac{20}{21}[/latex] : [latex]\frac{14}{5}[/latex] : [latex]\frac{5}{4}[/latex] : [latex]\frac{25}{11}[/latex]
5. Which of the following shows the approximate percentage increase in the turnover of Accenture during the six years?
    A. 450% B. 500% C. 600% D. 550% E. 300%

Answer: Option B
Explanation: Let the turnover of Accenture at the end of 2011 = 1 then the turnover of Accenture at the end of 2017
= 1 × [latex]\frac{110}{100}[/latex] × [latex]\frac{130}{100}[/latex] × [latex]\frac{125}{100}[/latex] × [latex]\frac{140}{100}[/latex] × [latex]\frac{150}{100}[/latex] × [latex]\frac{160}{100}[/latex] = 6.006
Reqd. % = [latex]\frac{(6 – 1)}{1}[/latex] × 100 = approximately 500%
Directions (1-5): Refer to the graph and answer the given questions.Data related to the number of shirts sold by two stores (A and B) during 5 months:

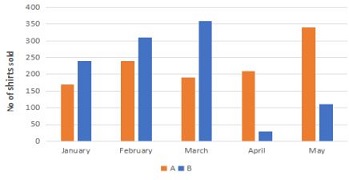
1. What is the respective ratio between the total number of shirts sold by store B in January and February together and that by the same store in April and May together?
    A. 10 : 9 B. 7 : 5 C. 5 : 3 D. 3 : 2 E. None of these

Answer: Option E
Explanation: Total number of shirts sold by store B in January and February
= 240 + 310 = 550
Total number of shirts sold by store B in April and May
= 30 + 110 = 140
=> Required ratio = [latex]\frac{550 }{140}[/latex]
= 55 : 14
2. What is the average number of shirts sold by store A in January, April and May?
    A. 270 B. 220 C. 260 D. 240 E. 230

Answer: Option D
Explanation: Number of shirts sold by store A in January, April and May
= 170 + 210 + 340 = 720
=> Required average = [latex]\frac{720 }{3}[/latex]
= 240.
3. The number of shirts sold by store A increased by what percent from February to May?
    A. 39 [latex]\frac{1}{3}[/latex] B. 41 [latex]\frac{2}{3}[/latex] C. 47 [latex]\frac{2}{3}[/latex] D. 43 [latex]\frac{1}{3}[/latex] E. 45 [latex]\frac{2}{3}[/latex]

Answer: Option B
Explanation: Number of shirts sold by store A in February = 240
Number of shirts sold by store A in May = 340
=> Required % increase = [latex]\frac{ 340 - 240}{240}[/latex] x 100
= [latex]\frac{125 }{3}[/latex] = 41 [latex]\frac{2}{3}[/latex] %
4. If the total number of shirts sold by store A and B together in June is 20% more than that sold in March, what was the total number of shirts sold by stores A and B together in June?
    A. 680 B. 690 C. 650 D. 670 E. 660

Answer: Option E
Explanation: Total number of shirts sold by store A and B together in March
= 190 + 360 = 550
=> Total number of shirts sold by store A and B together in June
= 550 + [latex]\frac{20}{100}[/latex] x 550
= 550 + 110 = 660
5. If the total number of shirts sold by stores A and B together in December is 25% less than that sold in April, what was the total number of shirts sold by stores A and B together in December?
    A. 415 B. 400 C. 180 D. 395 E. 425

Answer: Option C
Explanation: Total number of shirts sold by stores A and B together in April
= 210 + 30 = 240
=> Total number of shirts sold by stores A and B together in December
= 240 - [latex]\frac{25 }{100}[/latex] x 240
= 240 - 60 = 180
Directions (1-5): Study the following table chart carefully and answer the questions given beside.
TATA, A car manufacturing company, has five manufacturing units A, B, C, D, and E in India where it manufactures two models of cars (Nano and Sumo). The following tables gives the information about the production capacity of the five manufacturing units of India for the year 2017. Capacity Utilization is the actual production in a year expressed as a percentage of the Production Capacity of the given manufacturing units in that year.
Nano Sumo
Manufacturing units Production Capacity (In 1000 units) Capacity Utilization (In %) Production Capacity (In 1000 units) PCapacity utilization (In %)
A 36 40% 34 80%
B 32 50% 28 60%
C 20 80% 28 70%
D 60 30% 75 95%
E 42 90% 62 70%

1. Which manufacturing units has the absolute maximum difference between the total production of Nano and that of Sumo in the year 2017?
    A. A B. B C. C D. D E. E

Answer: Option D
Explanation: For unit A,
Total production of Nano = 40% of 36000 = 14,400
The total production of Sumo = 80% of 34000 = 27200
Difference = 12800
For unit B,
The total production of Nano = 50% of 32000 = 16000
The total production of Sumo = 60% of 28000 = 16800
Difference = 800
For unit C,
The total production of Nano = 80% of 20,000 = 16000
The total production of Sumo = 70% of 28000 = 19600
Difference = 3600
For unit D,
The total production of Nano = 30% of 60000 = 18000
The total production of Sumo = 95% of 75000 = 71250
Difference = 53250
For unit E,
The total production of Nano = 90% of 42000 = 37800
The total production of Sumo = 70% of 62000 = 43400
Difference = 5600
It is clear that the absolute difference is maximum for unit D
2. What is the difference between TATA’s total production capacity of Nano and that of Sumo in the year 2017?
    A. 37000 B. 27000 C. 18000 D. 42000 E. 42000

Answer: Option A
Explanation: TATA’s total production capacity of Nano in the year 2017 = 36 + 32 + 20 + 60 + 42 = 190 thousand
TATA’s total production capacity of Sumo in the year 2017 = 34 + 28 + 28 + 75 + 62 = 227 thousand
The required difference = 37 thousand
3. By what percentage (approximately) the capacity utilization of Nanomanufacturing units A and E together is more or less than the capacity utilization of Sumo manufacturing units B and D in 2017?
    A. 40% B. 45% C. 35% D. 25% E. 48%

Answer: Option A
Explanation: The capacity utilization for Nano in the year 2017 at A and E = 40% of 36k + 90% of 42k
= 14400 + 37800
= 14400 + 37800
= 52200
The capacity utilization for Sumo in the year 2017 at B and D = 60% of 28k + 95% of 75k
= 16800 + 71250
= 88050
Clearly, the capacity utilization of Nano is less than that of Sumo at given manufacturing units for 2017 by
= 35850
The req percentage = ( [latex]\frac{35850 }{88050 }[/latex] ) x 100% = 40%
4. What is the sum of the total number of cars manufactured by TATA in India in the year 2017?
    A. 280250 B. 280450 C. 280350 D. 280540 E. None of these

Answer: Option B
Explanation: The total of Nano manufactured in the year 2017 = 40% of 36 k + 50% of 32 k + 80% of 20 k + 30% of 60 k + 90% of 42 k = 102200
The total number of Sumo manufactured in the year 2017 = 80% of 34 k + 60% of 28 k + 70% of 28 k + 95% of 75 k + 70% of 62 k = 178250
Required sum = 280450
5. The production capacity of TATA in India for Nano in the year 2017 is approximately what percent of the production capacity of TATA in India for Sumo in that year?
    A. 55% B. 60% C. 74% D. 83% E. 92%

Answer: Option D
Explanation: TATA’s total production capacity of Nano in the year 2017 = 36 + 32 + 20 + 60 + 42 = 190 thousand
TATA’s total production capacity of Sumo in the year 2017 = 34 + 28 + 28 + 75 + 62 = 227 thousand
Reqd. % = [latex]\frac{190 × 100}{227}[/latex] = 83% approximately

Data Interpretation - Related Information
Data Interpretation Practice Sets for Competitive Exams
IBPS RRB Data Interpretation Quiz Day 1
IBPS RRB Data Interpretation Quiz Day 2
Book for Quantitative Aptitude