


 Introduction
The Union Minister for Finance and Corporate Affairs, Smt. Nirmala Sitharaman submitted the Economic Survey 2018-19 in the Parliament on 04-07-2019. The article Economic Survey Highlights 2018-2019 will explore the complete key highlights of Economic Survey 2018-2019.
Source: PIB
Economy
Private Investment as the Key Driver of Growth, Jobs, Exports and Demand:
- The survey states that pathways for trickle-down opened up during the last five years; and benefits of growth and macroeconomic stability reached the bottom of the pyramid.
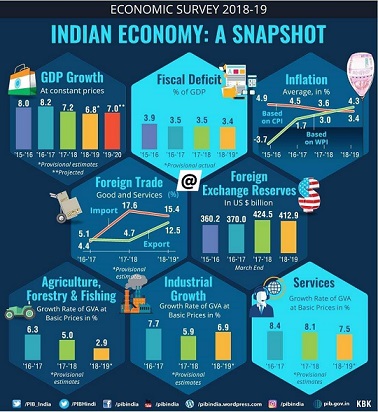
- The sustained real GDP growth rate of 8% needed for a $5 trillion economy by 2024-25.
- “Virtuous Cycle” of savings, investment and exports catalyzed and supported by a favorable demographic phase required for sustainable growth.
- Private investment- key driver for demand, capacity, labor productivity, new technology, creative destruction, and job creation.
- Survey departs from traditional Anglo-Saxon thinking by viewing the economy as being either in a virtuous or a vicious cycle and thus never in equilibrium.
- Key ingredients for a self-sustaining virtuous cycle:
- Presenting data as a public good.
- Emphasizing legal reforms.
- Ensuring policy consistency.
- Encouraging behavior change using principles of behavioral economics.
- Nourishing MSMEs to create more jobs and become more productive.
- Reducing the cost of capital.
- Rationalizing the risk-return trade-off for investments.
Policy for Real People, Not Robots:
- Decisions by real people deviate from impractical robots theorized in classical economics.
- Behavioral economics provides insights to ‘nudge’ people towards desirable behavior.
- Key principles of behavioral economics:
- Emphasizing the beneficial social norm.
- Changing the default option.
- Repeated reinforcements.
- Using insights from behavioral economics to create an aspirational agenda for social change:
- From ‘Beti Baco Beti Padhao’ to ‘BADLAV’ (Beti Aapki Dhan Lakshmi Aur Vijay Lakshmi).
- From ‘Swachh Bharat’ to ‘Sundar Bharat’.
- From ‘Give it up' for the LPG subsidy to ‘Think about the Subsidy’.
- From ‘Tax evasion’ to ‘Tax compliance’.
Nourishing Dwarfs to become Giants: Reorienting policies for MSME Growth:
- Survey focuses on enabling MSMEs to grow for achieving greater profits, job creation and enhanced productivity.
- Dwarfs (firms with less than 100 workers) despite being more than 10 years old, account for more than 50% of all organized firms in manufacturing by number.
- Contribution of dwarfs to employment is only 14% and productivity is a mere 8%.
- Large firms (more than 100 employees) account for 75% employment and close to90% of productivity despite accounting for about 15% by number.
- Unshackling MSMEs and enabling them to grow by way of:
- Asunset clause of fewer than 10 years, with necessary grand-fathering, for all size-based incentives.
- Deregulating labor law restrictions to create significantly more jobs, as evident from Rajasthan.
- Re-calibrating Priority Sector Lending (PSL) guidelines for direct credit flow to young firms in high employment elastic sectors.
- Survey also focuses on service sectors such as tourism, with high spillover effects on other sectors such as hotel & catering, transport, real estate, entertainment, etc., for job creation.
Data “Of the People, By the People, For the People”:
- Society’s optimal consumption of data is higher than ever given technological advances in gathering and storage of data.
- As data of societal interest is generated by the people, data can be created as a public good within the legal framework of data privacy.
- The government must intervene in creating data as a public good, especially of the poor and in social sectors.
- Merging the distinct datasets held by the Government already would generate multiple benefits.
Ending Matsyanyaya: How to Ramp up Capacity in the Lower Judiciary:
- Delays in contract enforcement and disposal resolution are arguably now the single biggest hurdle to the ease of doing business and higher GDP growth in India.
- Around 87.5 percent of pending cases are in the District and Subordinate Courts.
- 100 percent clearance rate can be achieved by filling out merely 2279 vacancies in the lower courts and 93 in High Courts.
- States of Uttar Pradesh, Bihar, Odisha and West Bengal need special attention.
- Productivity improvements of 25 percent in lower courts, 4 percent in High Courts and 18 percent in Supreme Court can clear backlog.
How does Policy Uncertainty affect Investment?
- Significant reduction in Economic Policy Uncertainty in India over the last one decade, even when economic policy uncertainty increased in major countries, especially the U.S.
- Uncertainty dampens investment growth in India for about five quarters.
- Lower economic policy uncertainty can foster a salutary investment climate.
- Survey proposes a reduction in economic policy uncertainty by way of:
- Consistency of actual policy with forwarding guidance.
- Quality assurance certification of processes in Government departments.
Planning Public Good Provision for the 21st Century:
- Sharp slowdown in population growth expected in next 2 decades. Most of India to enjoy demographic dividend while some states will transition to ageing societies by 2030s.
- National Total Fertility Rate expected to be below replacement rate by 2021.
- Working-age population to grow by roughly 9.7mn per year during 2021-31 and 4.2mn per year during 2031-41.
- Significant decline to be witnessed in elementary school-going children (5-14 age group) over the next two decades.
- States need to consolidate/merge schools to make them viable rather than build new ones.
- Policy makers need to prepare for aging by investing in health care and by increasing the retirement age in a phased manner.
From Swachh Bharat to Sundar Bharat via Swasth Bharat:
- Traceable health benefits brought about by Swachh Bharat Mission (SBM).
- 93.1% of the households have access to toilets.
- 96.5% of those with access to toilets are using them in rural India.
- 100% Individual Households Latrine (IHHL) Coverage in 30 states and UTs.
- Financial savings from a household toilet exceed the financial costs to the household by 1.7 times on average and 2.4 times for poorest households.
- Environmental and water management issues need to be incorporated in SBM for sustainable improvements in the long-term.
Enabling Inclusive Growth through Affordable, Reliable and Sustainable Energy:
- 2.5 times increase in per capita energy consumption needed for India to increase its real per capita GDP by $5000 at 2010 prices, and enter the upper-middle income group.
- 4 times increase in per capita energy consumption needed for India to achieve 0.8 Human Development Index score.
- India now stands at 4th in wind power, 5th in solar power and 5th in renewable power installed capacity.
- Rs 50,000 crore saved and 108.28 million tonnes of CO2 emissions reduced by energy efficiency programs in India.
- Share of renewable (excluding hydro above 25 MW) in total electricity generation increased from 6% in 2014-15 to 10% in 2018-19.
- Thermal power still plays a dominant role at 60% share.
- Market share of electric cars only 0.06% in India while it is 2% in China and 39% in Norway.
- Access to fast battery charging facilities needed to increase the market share of electric vehicles.
Effective Use of Technology for Welfare Schemes – Case of MGNREGS:
- Survey says that the efficacy of MGNREGS increased with the use of technology in streamlining it.
- Significant reduction in delays in the payment of wages with the adoption of NeFMS and DBT in MGNREGS.
- Demand and supply of work under MGNREGS increased, especially in distressed districts.
- Vulnerable sections of the society viz. women, SC and ST workforce increased under MGNREGS during economic distress.
Redesigning a Minimum Wage System in India for Inclusive Growth:
- Survey proposes a well-designed minimum wage system as a potent tool for protecting workers and alleviating poverty.
- Present minimum wage system in India has 1,915 minimum wages for various scheduled job categories across states.
- 1 in every 3 wage workers in India not protected by the minimum wage law.
- The survey supports the rationalization of minimum wages as proposed under the Code on Wages Bill.
- Minimum wages to all employment/workers proposed by the Survey.
- ‘National Floor Minimum Wage’ should be notified by the Central Government, varying across five geographical regions.
- Minimum wages by states should be fixed at levels not lower than the ‘floor wage’.
- Minimum wages can be notified based either on the skills or on geographical region or on both grounds.
- Survey proposes a simple and enforceable Minimum Wage System using technology.
- ‘National level dashboard’ under the Ministry of Labour & Employment for regular notifications on minimum wages, proposed by the Survey.
- The toll-free number to register a grievance on non-payment of the statutory minimum wages.
- Effective minimum wage policy as an inclusive mechanism for more resilient and sustainable economic development.
Social Infrastructure, Employment and Human Development:
- The public investments in social infrastructure like education, health, housing and connectivity is critical for inclusive development.
- Government expenditure (Centre plus States) as a percentage of GDP on
- Health: increased to 1.5 percent in 2018-19 from 1.2 percent in 2014-15.
- Education: increased from 2.8 percent to 3 percent during this period.
- Substantial progress in both quantitative and qualitative indicators of education is reflected in the improvements in Gross Enrolment Ratios, Gender Parity Indices and learning outcomes at primary school levels.
- Encouraging Skill Development by:
- Introduction of the skill vouchers as a financing instrument to enable youth to obtain training from any accredited training institutes.
- Involving industry in setting up of training institutes in PPP mode; in curriculum development; provision of equipment; training of trainers, etc.
- Personnel of Railways and para-military could be roped in for imparting training in difficult terrains.
- Create a database of Instructors, skill mapping of rural youth by involving local bodies to assess the demand-supply gaps are some of the other initiatives proposed.
- Net employment generation in the formal sector was higher at 8.15 lakh in March 2019 as against 4.87 lakh in February 2018 as per EPFO.
- Around 1, 90, 000 km of rural roads constructed under Pradhan Mantri Gram Sadak Yojana (PMGSY) since 2014.
- About 1.54 crore houses completed under Pradhan Mantri Awas Yojana (PMAY) as against a target of 1 crore pucca houses with basic amenities by 31st March 2019.
- Accessible, affordable and quality healthcare is provided through the National Health Mission and Ayushman Bharat scheme for a healthy India.
- Alternative healthcare, National AYUSH Mission launched to provide cost-effective and equitable AYUSH healthcare throughout the country to address the issue of affordability, by improving access to these services.
- Employment generation scheme, MGNREGA is prioritized by increasing actual expenditure over the budgetary allocation and an upward trend in budget allocation in the last four years.
- Services sector (excluding construction) has a share of 54.3 per cent in India’s GVA and contributed more than half of GVA growth in 2018-19.
- The IT-BPM industry grew by 8.4 percent in 2017-18 to US$ 167 billion and is estimated to reach US$ 181 billion in 2018-19.
- The services sector growth declined marginally to 7.5 percent in 2018-19 from 8.1 percent in 2017-18.
- Accelerated sub-sectors: Financial services, real estate, and professional services.
- Decelerated sub-sectors: Hotels, transport, communication and broadcasting services.
- Services share in employment is 34 percent in 2017.
- Tourism:
- 10.6 million foreign tourists received in 2018-19 compared to 10.4 million in 2017-18.
- Forex earnings from tourism stood at US$ 27.7 billion in 2018-19 compared to US$ 28.7 billion in 2017-18.
- Overall Index of Eight Core Industries registered a growth rate of 4.3 percent in 2018-19.
- India’s ranking improved by 23 to 77th position in 2018 among 190 countries assessed by the World Bank Doing Business (DB) Report, 2019.
- Road construction grew @ 30 km per day in 2018-19 compared to 12 km per day in 2014-15.
- Rail freight and passenger traffic grew by 5.33 percent and 0.64 percent respectively in 2018-19 as compared to 2017-18.
- Total telephone connections in India touched 118.34 crores in 2018-19
- The installed capacity of electricity has increased to 3, 56,100 MW in 2019 from 3, 44,002 MW in 2018.
- Public-Private Partnerships are quintessential for addressing infrastructure gaps
- Building sustainable and resilient infrastructure has been given due importance with sector-specific flagship programs such as SAUBHAGYA scheme, PMAY, etc
- Institutional mechanism is needed to deal with time-bound resolution of disputes in infrastructure sector
- Gross Capital Formation (GCF) in agriculture as percentage of GVA marginally declined to 15.2 per cent in 2017-18 as compared to 15.6 per cent in 2016-17.
- The public sector GCF in agriculture as a percentage of GVA increased to 2.7 percent in 2016-17 from 2.1 percent in 2013-14.
- Women’s participation in agriculture increased to 13.9 percent in 2015-16 from 11.7 percent in 2005-06 and their concentration is highest (28 percent) among small and marginal farmers.
- A shift is seen in the number of operational land holdings and area operated by operational land holdings towards small and marginal farmers.
- 89% of the groundwater extracted is used for irrigation. Hence, the focus should shift from land productivity to ‘irrigation water productivity’. The thrust should be on micro-irrigation to improve water use efficiency.
- Fertilizer response ratio has been declining over time. Organic and natural farming techniques including Zero Budget Natural Farming (ZBNF) can improve both water use efficiency and soil fertility.
- Adopting appropriate technologies through Custom Hiring Centers and implementation of ICT are critical to improving resource-use efficiency among small and marginal farmers.
- Diversification of livelihoods is critical for inclusive and sustainable development in agriculture and allied sectors. Policies should focus on
- Dairying as India is the largest producer of milk.
- Livestock rearing particularly of small ruminants.
- Fisheries sector, as India is the second largest producer.
- Financial Year 2018-19 ended with fiscal deficit at 3.4 per cent of GDP and debt to GDP ratio of 44.5 per cent (Provisional).
- As per cent of GDP, total Central Government expenditure fell by 0.3 percentage points in 2018-19 PA over 2017-18:
- 0.4 percentage point reduction in revenue expenditure and 0.1 percentage point increase in capital expenditure.
- States’ own tax and non-tax revenue displays robust growth in 2017-18 RE and envisaged to be maintained in 2018-19 BE.
- General Government (Centre plus states) on the path of fiscal consolidation and fiscal discipline.
- The revised fiscal glide path envisages achieving a fiscal deficit of 3 percent of GDP by FY 2020-21 and Central Government debt to 40 percent of GDP by 2024-25.