


 Introduction
SBI PO 2019 - Main Examination, Objective Tests conducted in online Mode, has: a duration of 3 hours, 4 Sections, a total of 155 questions, a Maximum score of 200 marks, and, is followed by a Descriptive Test (English language) for a duration of 30 minutes. The 4 Sections are timed: Reasoning & Computer Aptitude, Data Analysis & Interpretation, General/ Economy/ Banking Awareness and English language. The section wise details are as shown below.
The Objective Tests are followed by a Descriptive Paper (Letter Writing + Essay Writing). There is a Negative marking in SBI PO Data Analysis and Interpretation Main exam and 0.25 marks are deducted for each wrong answer. Candidates must clear the cut-off in all the sections to qualify for the Group Exercises & Interview.
Pattern
| S.No. | Name of Test | Number of Questions | Mark | Duration |
|---|---|---|---|---|
| 1 | Reasoning & Computer Aptitude | 45 | Total Max. Marks 200 | 60 minutes |
| 2 | Data Analysis & Interpretation | 35 | 45 minutes | |
| 3 | General/ Economy/ Banking Awareness | 40 | 35 minutes | |
| 4 | English Language | 35 | 40 minutes | |
| Total | 155 | 3 Hours |
Syllabus
| S.No | Topics |
|---|---|
| 1 | Tables |
| 2 | Pie-Charts |
| 3 | Bar Graphs |
| 4 | Data Analysis |
| 5 | Line Graphs |
| 6 | Radar Graphs |
| 7 | Case lets |
| 8 | Combined data sets |
| 9 | Missing Data Interpretation |
| 10 | Data Sufficiency, Probability |
| 11 | Permutation and Combination |
| 12 | Profit & Loss, Simple Interest |
| 13 | Compound Interest |
| 14 | Mensuration |
| 15 | Boat and Stream Problems |
| 16 | Problems on Ages |
| 17 | Percentages Increase/Decrease |
| 18 | Averages |
| 19 | Ratio and Proportions |
| 20 | Number Series |
| 21 | Time and Work |
| 22 | Mixture and Alligations |
Note: Penalty for Wrong Answers.
There will be penalty for wrong answers marked in the Objective Tests. For each question for which a wrong answer has been given by the candidate one fourth of the marks assigned to that question will be deducted as penalty to arrive at corrected score. If a question is left blank, i.e. if no answer is marked by the candidate, there will be no penalty for that question.
Samples
Double Pie Chart
The distribution of students of graduate and post-graduate levels in seven different institutes like M, N, P, Q, R, S and T in a town are listed in the below pie chart. Study the charts and answer the given questions.
Total number of graduate level students = 27300
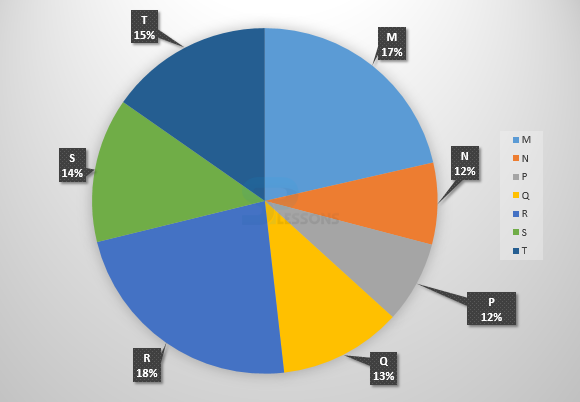 Total number of post-graduate level students = 24700
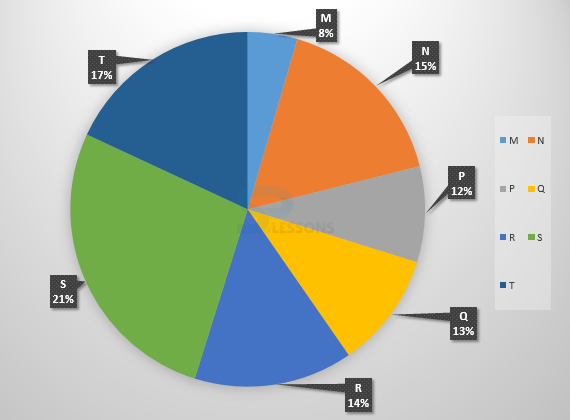 1. What is the total number of graduate and post-graduate level students in institute R?
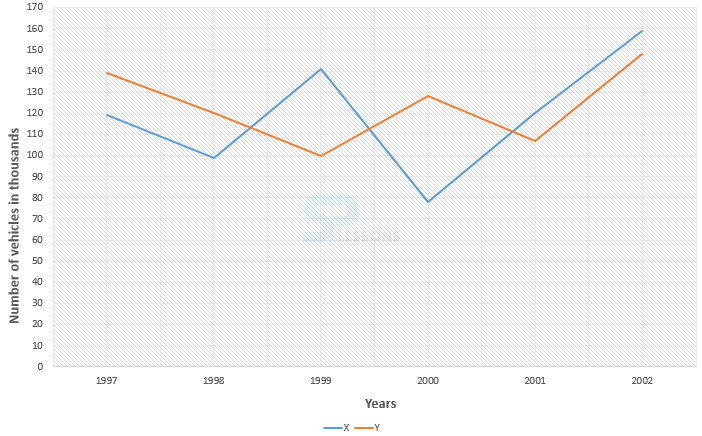 1. What is the difference between the number of vehicles manufactured by company Y in 2000 and 2001?
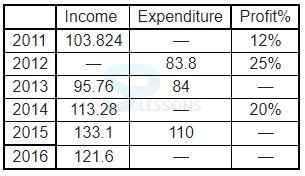 Note: (i) Income and expenditure are in million rupees and
(ii) Percentage increase in profit percent in year 2016 in comparison to previous year is 33 (1/3)%.
Q1. Find the expenditure of the company in 2016.
Note: (i) Income and expenditure are in million rupees and
(ii) Percentage increase in profit percent in year 2016 in comparison to previous year is 33 (1/3)%.
Q1. Find the expenditure of the company in 2016.
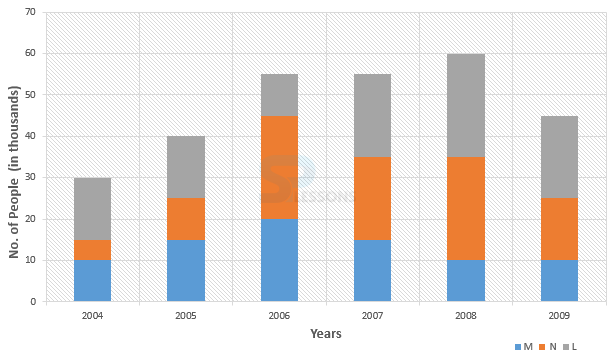 1. What is the average number of people using mobile service M for all the years together?
- (a) 8320
(b) 7916
(c) 9116
(d) 8372
- (a) 13 : 19
(b) 21 : 13
(c) 13 : 8
(d) 19 : 13
- (a) 7516
(b) 8463
(c) 9127
(d) 9404
- (a) 50000
(b) 42000
(c) 33000
(d) 21000
(e) 13000
- (a) 19000
(b) 22000
(c) 26000
(d) 28000
(e) 29000
- (a) 173
(b) 164
(c) 132
(d) 97
(e) 61
- (a) 94 million
(b) 95 million
(c) 99 million
(d) 81 million
(e) None of these
- (a) 1.22% more
(b) 1.69% less
(c) 1.83% more
(d) 1.45% less
(e) None of these
- (a) 93.44 million
(b) 92.88 million
(c) 93.98 million
(d) 94.88 million
(e) None of these
- (a) 15.77
(b) 18.92
(c) 16.47
(d) 18.24
(e) 17.67
- (a) 83.202 million
(b) 85.6211 million
(c) 81.243 million
(d) 84.2025 million
(e) None of these
- (a) 16 [latex]\frac{2}{3}[/latex]
(b) 14444 [latex]\frac{1}{6}[/latex]
(c) 16666[latex]\frac{2}{3}[/latex]
(d) All of these.
(e) None of these.
- (a) 89.72
(b) 93.46
(c) 88.18
(d) 91.67
(e) None of these
- (a) 8 : 7
(b) 3 : 2
(c) 19 : 13
(d) 15 : 11
(e) none of these
- (a) 50 minutes
(b) 60 minutes
(c) 108 minutes
(d) 40 minutes
(e) 72 minutes
- (a) 50
(b) 60
(c) 36
(d) 48
(e) 72
- I. 2x^2 – 15√3x + 84 = 0
II. 3y2 – 10√3y + 9 = 0
- (a) x > y
(b) x < y
(c) x ≥ y
(d) x ≤ y
(e) x = y or relation cannot be established