 Introduction
NHB Assistant Manager (AM) Online Test, will comprise of Objective Tests for 200 marks consisting of 4 Sections and Descriptive Test for 25 marks as follows. A composite time of 3 Hours will be given for answering the questions for the Objective tests and 30 minutes for Descriptive test. The below sections gives the detailed information about NHB AM Quantitative Aptitude Section.
 Pattern
| Sr.No. | Name of Tests | No. of Questions | Maximum Marks | Medium of Exam | Time allotted for each test (Separately timed) | Type of Test |
|---|---|---|---|---|---|---|
| 1 | Reasoning and Computer Aptitude | 45 | 60 | English & Hindi | 60 Minutes | Objective |
| 2 | General Awareness (with special focus on Economy & Banking) and Computer Knowledge | 50 | 50 | English & Hindi | 40 Minutes | |
| 3 | English Language | 25 | 30 | English | 35 Minutes | |
| 4 | Quantitative Aptitude (with special emphasis on Data analysis and interpretation) | 35 | 60 | English & Hindi | 45 Minutes | |
| Total | 155 | 200 | 03 Hours | |||
| English Language* (Letter Writing and Essay) | 02 | 25 | English | 30 minutes | Descriptive | |
 Syllabus
[Click Here] for NHB Assistant Manager Online Exam Syllabus
Note:
Each question in Objective Tests will have five alternative choices, out of which one will be the correct answer. There will be a penalty for wrong answers marked in the Objective Tests. For every wrong answer marked, one fourth of the marks assigned to that question will be deducted as penalty to arrive at corrected score. If a question is left blank, i.e. no answer is marked by the candidate, there will be no penalty for that question.
 Samples
Data Interpretation ( Tabular, Radar graph )
1. What is the different between the number of students passed with 30 as cut-off marks in Chemistry and those passed with 30 as cut-off marks in aggregate?
| Subject | Marks out of 50 | ||||
|---|---|---|---|---|---|
| 40 and above | 30 and above | 20 and above | 10 and above | 0 and above | |
| Physics | 9 | 32 | 80 | 92 | 100 |
| Chemistry | 4 | 21 | 66 | 81 | 100 |
| Average (Aggregate) | 7 | 27 | 73 | 87 | 100 |
- A. 3
B. 4
C. 5
D. 6
- A. 27
B. 32
C. 34
D. 41
- A. 21%
B. 27%
C. 29%
D. 31%
- A. 13
B. 19
C. 20
D. 27
- A. 40-45
B. 30-40
C. 20-30
D. Below 20
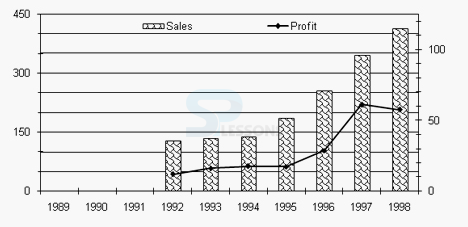
- A. 1995
B. 1996
C. 1997
D. 1998
- A. Once
B. Twice
C. Thrice
D. Never
- A. Once
B. Twice
C. Thrice
D. Never
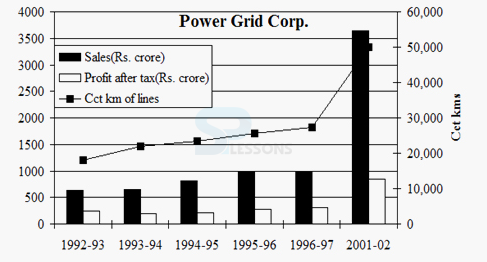
- A. 270%
B. 154%
C. 108%
D. 54%
- A. 1992-93
B. 1993-94
C. 2001-02
D. 1996-97
- A. A16
B. G4
C. E4
D. E3
- A. 85
B. 97
C. 109
D. 178
- A. IX
B. XXIII
C. XV
D. XVII
- A. 70
B. 71
C. 80
D. 96
- A. 8
B. 14
C. 43
D. 44
Data Sufficiency
1. A can do a piece of work in 4 hours; B and C together can do it in 3 hours, while A and C together can do it in 2 hours. How long will B alone take to do it?
- A. 8 hours
B. 10 hours
C. 12 hours
D. 24 hours
- A. 1.68 sec
B. 15 sec
C. 16 sec
D. 16.8 sec
- A. 50 sec
B. 25 sec
C. 40 sec
D. 65 sec
- A. Rs.28
B. Rs.280
C. Rs.140
D. Rs.70
- A. Rs.350
B. Rs.400
C. Rs.573
D. Rs.480


