 Introduction
The chapter Highcharts Exports Modules demonstrate about Export Modules which allow user to download the charts as JPG, PDF, PNG or SVG vector images.
 Description
Using the Highcharts Export Modules user can print the chart directly without disturbing the elements from the web page. The Highcharts Export Modules can be downloaded or included directly from the official website of Highcharts as shown below.
<script src="http://code.highcharts.com/modules/exporting.js"></script>
<!—optional Module -->
<script src="http://code.highcharts.com/modules/offline-exporting.js"></script>
As per Highcharts version 3.0 the exported image size is calculated based on following rules.
- The image take predence when the options exporting.sourceHeight and exporting.sourceWidth are set.
- The options chart.height and chart.width are used for the exported image.
- If the size haven’t defined, the image take the default size 600/400 PX.
 Description
The module offline-exporting allows image to export the charts without sending any data to the external server following are few solutions for this case.
- Don’t work with the old browsers such as IE8.
- Save the cost by setting the own server.
- Avoid user’s sending the chart to the Highsoft’s servers.
 Example
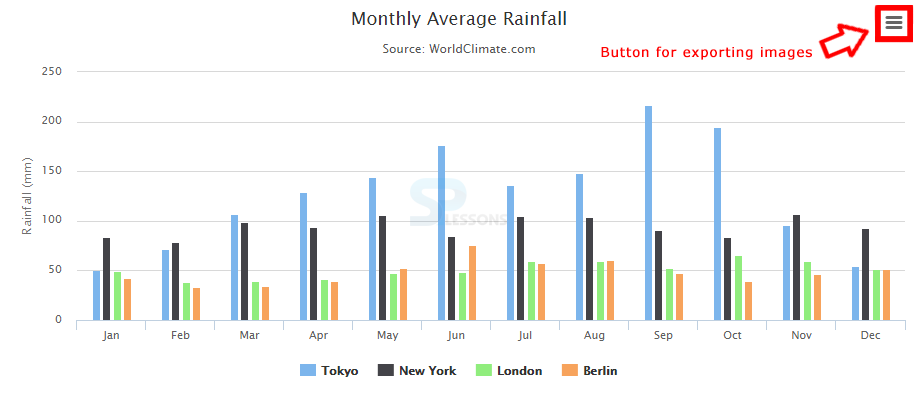
The code below demonstrate the Highcharts Exports Modules created with a button to export and save the chart images.
[c]
<!DOCTYPE html>
<html>
<head>
<title>Highcharts</title>
<script src="https://ajax.googleapis.com/ajax/libs/jquery/2.2.0/jquery.min.js"></script>
<script src="http://code.highcharts.com/highcharts.js"></script>
</head>
<body>
<div id="container" style="width: 600px; height: 00px; margin: 0 auto"></div>
<script language="JavaScript">
$(function () {
$('#container').highcharts({
chart: {
type: 'column'
},
title: {
text: 'Monthly Average Rainfall'
},
xAxis: {
categories: [
'Jan',
'Feb',
'Mar',
'Apr',
'May',
'Jun',
'Jul',
'Aug',
'Sep',
'Oct',
'Nov',
'Dec'
],
crosshair: true
},
yAxis: {
min: 0,
title: {
text: 'Rainfall (mm)'
}
},
tooltip: {
headerFormat: '<span style="font-size:10px">{point.key}</span><table>',
pointFormat: '<tr><td style="color:{series.color};padding:0">{series.name}: </td>' +
'<td style="padding:0"><b>{point.y:.1f} mm</b></td></tr>',
footerFormat: '</table>',
shared: true,
useHTML: true
},
plotOptions: {
column: {
pointPadding: 0.2,
borderWidth: 0
}
},
series: [{
name: 'Tokyo',
data: [49.9, 71.5, 106.4, 129.2, 144.0, 176.0, 135.6, 148.5, 216.4, 194.1, 95.6, 54.4]
}, {
name: 'New York',
data: [83.6, 78.8, 98.5, 93.4, 106.0, 84.5, 105.0, 104.3, 91.2, 83.5, 106.6, 92.3]
}, {
name: 'London',
data: [48.9, 38.8, 39.3, 41.4, 47.0, 48.3, 59.0, 59.6, 52.4, 65.2, 59.3, 51.2]
}, {
name: 'Berlin',
data: [42.4, 33.2, 34.5, 39.7, 52.6, 75.5, 57.4, 60.4, 47.6, 39.1, 46.8, 51.1]
}]
});
});
</script>
</body>
</html>
[/c]
 Output
 Key Points
- Highcharts Export Modules - The exporting module is a required dependency even if fallback is disabled.
- Highcharts Export Modules - A context button with a menu appears in the top right corner of the chart in Highcharts.


