 Introduction
IBPS PO 2019 – Main Examination, conducted in online Mode, has: a duration of 3 hours, 4 Sections, a total of 155 questions, a maximum score of 200 marks, and, is followed by a Descriptive Test (English language) for a duration of 30 minutes. The 4 Sections are timed: Reasoning & Computer Aptitude, General/ Economy/ Banking Awareness, English language, Data Analysis & Interpretation. The section wise details are as shown below. The objective test is followed by a Descriptive Paper (Essay Writing + Letter Writing)
 Pattern
| S.No. | Name of Test (NOT BY SEQUENCE) | No. of Questions | Maximum Marks | Medium of Exam | Time Allotted for Each Test (Separately Timed) |
|---|---|---|---|---|---|
| 1 | Reasoning & Computer Aptitude | 45 | 60 | English & Hindi | 60 minutes |
| 2 | General/Economy/Banking Awareness | 40 | 40 | English & Hindi | 35 minutes |
| 3 | English Language | 35 | 40 | English | 40 minutes |
| 4 | Data Analysis and Interpretation | 35 | 60 | English & Hindi | 45 minutes |
| TOTAL | 155 | 200 | 3 hours | ||
| 5 | English Language (Letter Writing & Essay) | 2 | 25 | English | 30 minutes |
 Syllabus
Syllabus -IBPS PO Data Analysis and Interpretation - Main Examination
| S.No. | Topics |
|---|---|
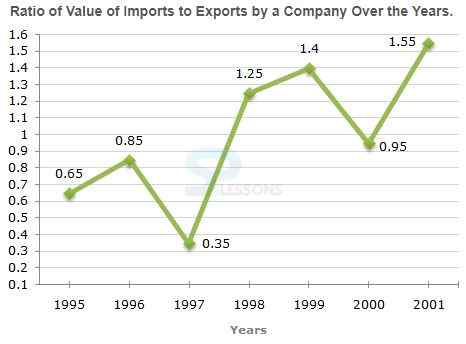
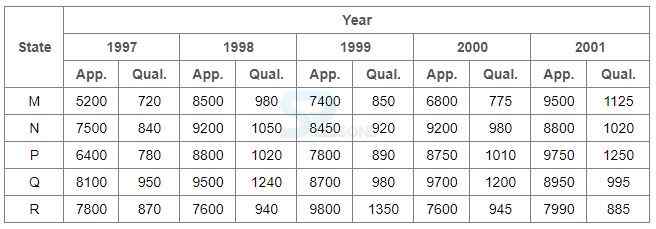
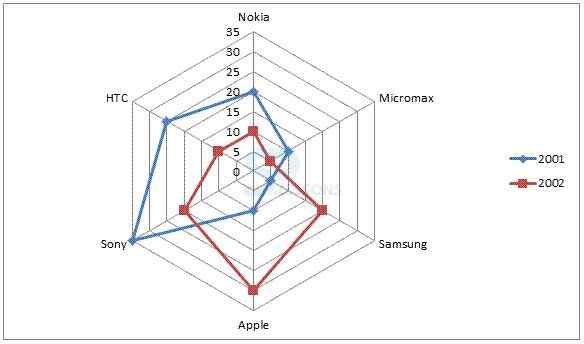
| 1 | Data Interpretation (Bar Graph, Line Chart, Tabular, Caselet, Radar/Web, Pie Chart) |
| 2 | Inequalities (Quadratic Equations) |
| 3 | Number Series |
| 4 | Approximation and Simplification |
| 5 | Data Sufficiency |
| 6 | Miscellaneous Arithmetic Problems (HCF and LCM, Profit and Loss, SI & CI, Problem on Ages, Work and Time, Speed Distance and Time, Probability, Mensuration, Permutation and Combination, Average, Ratio and Proportion, Partnership, Problems on Boats and Stream, Problems on Trains, Mixture and Allegation, Pipes and Cisterns) |
 Samples
Sample Questions- IBPS PO Data Analysis and Interpretation - Main Examination
Bar Graph:
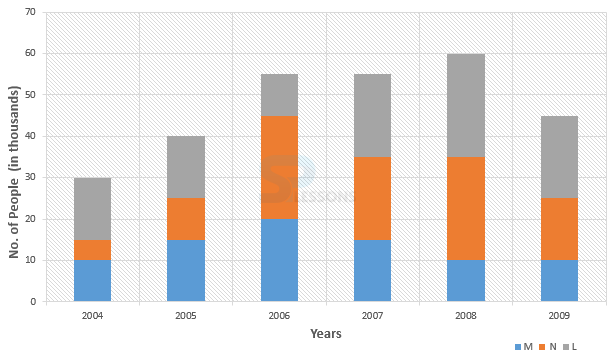
Number of people (in thousand) using three different types of mobile services over the years are given in the graph. Study the given graph and answer the given questions.
1. What is the average number of people using mobile service M for all the years together?
- (a) 16 [latex]\frac{2}{3}[/latex]
(b) 14444 [latex]\frac{1}{6}[/latex]
(c) 16666[latex]\frac{2}{3}[/latex]
(d) All of these.
(e) None of these.
- (a) 89.72
(b) 93.46
(c) 88.18
(d) 91.67
(e) None of these.
- (a) 8 : 7
(b) 3 : 2
(c) 19 : 13
(d) 15 : 11
(e) none of these.
- A. Rs. 250 crores
B. Rs. 300 crores
C. Rs. 357 crores
D. Rs. 420 crores
- A. 1995
B. 1996
C. 1997
D. 2000
- A. 72
B. 56
C. 28
D. Data inadequate
- A. Rs. 370 crores
B. Rs. 320 crores
C. Rs. 280 crores
D. Rs. 275 crores
- A. 1
B. 2
C. 3
D. 4
- A. 72%
B. 77%
C. 80%
D. 83%
- A. 8700
B. 8760
C. 8990
D. 8920
- A. 1997
B. 1998
C. 1999
D. 2001
- A. 12.36%
B. 12.16%
C. 11.47%
D. 11.15%
- A. 11.49%
B. 11.84%
C. 12.21%
D. 12.57%
- (a) 6
(b) 8
(c) 10
(d) 11
(e) 12
- (a) 140
(b) 200
(c) 180
(d) 160
(e) None of these
- (a) 28
(b) 32
(c) 29
(d) 31
(e) 30
- (a) 15 : 8
(b) 1 : 2
(c) 8 : 15
(d) 2 : 1
(e) 7 : 11
- (a) 1900
(b) 2040
(c) 2020
(d) 2031
(e) 2042
- (a) Nokia
(b) Sony
(c) Apple
(d) Samsung
- (a) 17.5
(b) 18.5
(c) 20
(d) 22
- (a) 3 : 4
(b) 4 : 5
(c) 1 : 2
(d) 7 : 8
- (a) 20000
(b) 30000
(c) 22000
(d) 25000
- (a) 200%
(b) 100%
(c) 300%
(d) 250%
- A. 14100
B. 15600
C. 16500
D. 17000
- A. 11 : 23
B. 13 : 11
C. 23 : 11
D. 11 : 13
- A. 18500
B. 20500
C. 22000
D. 26000
- A. 11250
B. 12760
C. 13140
D. 13780
1. If -5 > a and a > b then -5 is
- A. less than a
B. greater than b
C. grater than a
D. less than b
- A. x > 6
B. x < 5
C. x 2
- A. a < 9
B. a < 12
C. a < 13
D. a < 11
- A. x gt; 40
B. x gt; 50
C. x gt; 60
D. x gt; 70
- A. x > z
B. x < z
C. x = 0
D. y = 0
1. 4, 6, 9, 13,
- A. 15
B. 12
C. 18
D. 17
- A. 80
B. 100
C. 64
D. 84
- A. 99
B. 88
C. 121
D. 101
- A. 8
B. 9
C. 64
D. 16
- A. 28
B. 36
C. 54
D. 34
1. 9000 + 16[latex]\frac{2}{3}[/latex]% of ? = 10500
- A. 1500
B. 1750
C. 9000
D. 7500
E. None of these
- A. 150 [latex]\frac{1}{3}[/latex]
B. 150 [latex]\frac{2}{3}[/latex]
C. 149 [latex]\frac{2}{3}[/latex]
D. 149 [latex]\frac{1}{3}[/latex]
- A. 9
B. 3
C. 0.3
D. 0.03
E. None of these
- A. 1109300
B. 1109400
C. 1108400
D. 1108300
E. 1109200
- A. 130
B. 135
C. 138
D. 148
E. 142
Directions (1 - 5): In each of the questions below consists of a question and two statements numbered I and II given below it. You have to decide whether the data provided in the statements are sufficient to answer the question. Read both the statements and
Give answer
- (A) If the data in statement I alone are sufficient to answer the question, while the data in statement II alone are not sufficient to answer the question
(B) If the data in statement II alone are sufficient to answer the question, while the data in statement I alone are not sufficient to answer the question
(C) If the data either in statement I alone or in statement II alone are sufficient to answer the question
(D) If the data given in both statements I and II together are not sufficient to answer the question and
(E) If the data in both statements I and II together are necessary to answer the question.
- A. I alone is sufficient while II alone is not sufficient
B. II alone is sufficient while I alone is not sufficient
C. Either I or II is sufficient
D. Neither I nor II is sufficient
E. Both I and II are sufficient
- A. I alone is sufficient while II alone is not sufficient
B. II alone is sufficient while I alone is not sufficient
C. Either I or II is sufficient
D. Neither I nor II is sufficient
E. Both I and II are sufficient
- A. I alone is sufficient while II alone is not sufficient
B. II alone is sufficient while I alone is not sufficient
C. Either I or II is sufficient
D. Neither I nor II is sufficient
E. Both I and II are sufficient
- A. I alone is sufficient while II alone is not sufficient
B. II alone is sufficient while I alone is not sufficient
C. Either I or II is sufficient
D. Neither I nor II is sufficient
E. Both I and II are sufficient
- A. I alone is sufficient while II alone is not sufficient
B. II alone is sufficient while I alone is not sufficient
C. Either I or II is sufficient
D. Neither I nor II is sufficient
E. Both I and II are sufficient
HCF And LCM
1. Find the greatest number that will divide 43, 91 and 183 so as to leave the same remainder in each case.
- A. 4
B. 7
C. 9
D. 13
- A. 120
B. 240
C. 360
D. 480
- A. 3
B. 4
C. 5
D. 6
- A. 3%
B. 4%
C. 5%
D. 6%
E. None of these
- A. Rs. 2.50
B. Rs. 3
C. Rs. 3.75
D. Rs. 4
E. None of these
- A. 14 years
B. 19 years
C. 33 years
D. 38 years
- A. Rs. 375
B. Rs. 400
C. Rs. 600
D. Rs. 800
- A. 8 kmph
B. 11 kmph
C. 12 kmph
D. 14 kmph
- A. [latex]\frac{1}{13}[/latex]
B. [latex]\frac{3}{13}[/latex]
C. [latex]\frac{1}{4}[/latex]
D. [latex]\frac{9}{52}[/latex]
- A. 120 [latex]{cm}^2[/latex]
B. 130 [latex]{cm}^2[/latex]
C. 312 [latex]{cm}^2[/latex]
D. 315 [latex]{cm}^2[/latex]
E. None of these
- A. 360
B. 480
C. 720
D. 5040
E. None of these
- A. 250
B. 276
C. 280
D. 285
- A. 2 : 3 : 4
B. 6 : 7 : 8
C. 6 : 8 : 9
D. None of these
- A. Rs. 8400
B. Rs. 11,900
C. Rs. 13,600
D. Rs. 14,700
- A. 1.2 km
B. 1.8 km
C. 2.4 km
D. 3.6 km
- A. 10
B. 18
C. 36
D. 72
- A. 26.34 litres
B. 27.36 litres
C. 28 litres
D. 29.16 litres
- A. 1 hour
B. 2 hours
C. 6 hours
D. 8 hours
Note:
IBPS PO - Data Analysis & Interpretation Study Guide - Click Here - IBPS reserves the right to modify the structure of the examination which will be intimated through its website.
- Detailed information regarding the examination will be given in an Information Handout, which will be made available for the candidates to download along with the call letters from the authorized IBPS Website
- Each candidate will be required to obtain a minimum score in each test of Online Main examination and also a minimum total score to be considered to be shortlisted for interview.
- Depending on the number of vacancies available, cut-offs will be decided and candidates will be shortlisted for interview.
- Prior to the completion of the interview process, scores obtained in the online Main examination will not be shared with the candidates shortlisted for interview.
- Marks obtained in the main examination only will be considered for shortlisting for interview and also for final merit listing


