 Introduction
This chapter demonstrates about the SVG Path, all basic shapes of the elements can be created with path element only. Path contains the set of points following are the concepts covered in this chapter.
- SVG Path
 Description
W3C defines Path "as if the pen were lifted and moved to another location" all the basic elements can be created by path element only. Path consist of set of points, lines, and arcs which have the path data attribute defined as D attribute these attribute moved through the direction like line, arcs, cubic, quadratic Beziers and close path. Path is defined by
<path> element following are the commands as shown below for the path data.
- moveto = M
- lineto = L
- vertical lineto = V
- horizontal lineto = H
- curveto = C
- smooth curveto = S
- smooth quadratic Bezier curveto = T
- quadratic Bezier curve = Q
- elliptical Arc = A
- closepath = Z
 Description
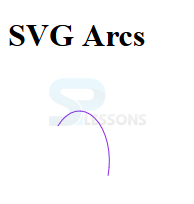
Arcs are used by the Path element Arcs contains the A and a commands. In the lines for the end points defined with upper case commands and the starting points defined with the lower case commands. Upper case commands are the absolute coordinates and lower case commands are the relative coordinates. The code below demonstrates the drawing an arcs by using SVG path.
[html]
<!DOCTYPE html>
<html>
<head>
<meta charset="UTF-8">
<title>SVG Path</title>
<h1>SVG Arcs</h1>
</head>
<body>
<svg xmlns="http://www.w3.org/2000/svg"
xmlns:xlink="http://www.w3.org/1999/xlink">
<path d="M50,50
A30,50 0 0,1 100,100"
style="stroke:#8A2BE2; fill:none;"/>
</svg>
</body>
</html>
[/html]
Result
Run the above code in a preferred browser the output get display as shown in below image.
 Description
By using the SVG path user can draw the multiple images those are starting from the starting point to the ending point. Following are some examples to demonstrates the SVG path.
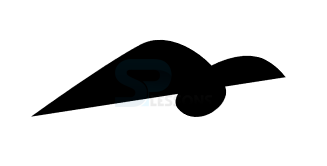
The code below demonstrates the path flow from starting point to the ending point.
[html]
<!DOCTYPE html>
<html>
<head>
<meta charset="UTF-8">
<title>SVG fundamentals</title>
</head>
<body>
<svg height="300" width="300">
<path d="M25,181.631c0,0,72.033-52.283,109.5-72.131
c38.32-20.3,89.434,30.521,85.467,49.761S186,
191.5,171.5,173s53.434-66.439,87.967-48.22c8.342,
4.401,14.961,10.556,20.202,17.36"
</svg>
</body>
</html>
[/html]
Result
Run the above code in a preferred browser the output get display as shown in below image.
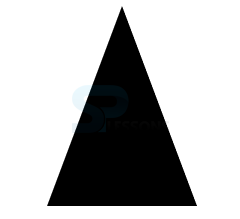
The code below demonstrates the SVG path of the triangle.
[html]
<!DOCTYPE html>
<html>
<body>
<svg height="300" width="300">
<path d="M150 0 L75 200 L225 200 Z" />
Sorry, your browser does not support inline SVG.
</svg>
</body>
</html>
[/html]
Result
Run the above code in a preferred browser the output get display as shown in below image.
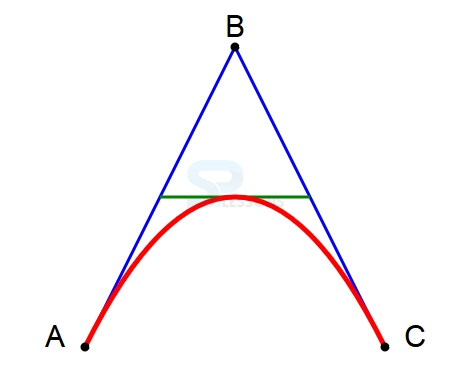
The code below demonstrates the quadratic Bezier curve from starting point to ending point.
[html]
<!DOCTYPE html>
<html>
<body>
<svg height="400" width="450">
<path id="lineAB" d="M 100 350 l 150 -300" stroke="blue" stroke-width="3" fill="none" />
<path id="lineBC" d="M 250 50 l 150 300" stroke="blue" stroke-width="3" fill="none" />
<path d="M 175 200 l 150 0" stroke="green" stroke-width="3" fill="none" />
<path d="M 100 350 q 150 -300 300 0" stroke="red" stroke-width="5" fill="none" />
<!-- Mark relevant points -->
<g stroke="black" stroke-width="3" fill="black">
<circle id="pointA" cx="100" cy="350" r="3" />
<circle id="pointB" cx="250" cy="50" r="3" />
<circle id="pointC" cx="400" cy="350" r="3" />
</g>
<!-- Label the points -->
<g font-size="30" font-family="sans-serif" fill="black" stroke="none" text-anchor="middle">
<text x="100" y="350" dx="-30">A</text>
<text x="250" y="50" dy="-10">B</text>
<text x="400" y="350" dx="30">C</text>
</g>
</svg>
</body>
</html>
[/html]
Result
Run the above code in a preferred browser the output get display as shown in below image.
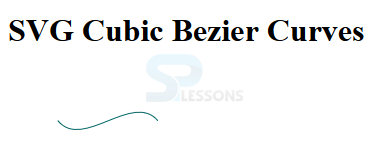
The code below demonstrates the Cubic Bazier Curves which can be done by the c and c commands. Cubic Bazier curves are similar to the Quadratic Bazier but contains only one control point instead of two control points.
[html]
<!DOCTYPE html>
<html>
<head>
<meta charset="UTF-8">
<title>SVG Path</title>
<h1>SVG Cubic Bezier Curves</h1>
</head>
<body>
<svg xmlns="http://www.w3.org/2000/svg"
xmlns:xlink="http://www.w3.org/1999/xlink">
<path d="M50,50 C75,80 125,20 150,50"
style="stroke: #006666; fill:none;"/>
</svg>
</body>
</html>
[/html]
Result
Run the above code in a preferred browser the output get display as shown in below image.
 Key Points
- All commands defined with lower letters only.
- Path starts from starting point to ending point.
- Two control points is called as cubic.
