


 Introduction
SIB PO Stage – 1 Online Examination, conducted in online Mode, has: a duration of 2 hours 20 minutes, a total of 160 questions, a maximum score of 200 marks, and consists of 4 sections, namely – Reasoning & Computer Aptitude, English Language, General/ Economy/ Banking Awareness, Data Analysis & Interpretation. There is a Negative marking in SIB PO Stage – 1 Online exam and [latex]{(\frac {1}{4})}^{th}[/latex] marks are deducted for each wrong answer. Candidates must clear the cut-off in all the sections to qualify for the SIB PO Group Discussion and Personal Interview.
The article SIB PO Data Analysis & Interpretation provides complete details of Data Analysis & Interpretation syllabus and provides study guide with answers. By solving this questions candidates can improve and maintain, speed, and accuracy in the exams.
Pattern
The SIB PO 2019 Stage - 1 Online Test consists of four different sections containing different marks with a total of 200 marks .
SIB PO Exam Syllabus- Data Analysis & Interpretation 40 Marks
| Sr. No | Name of Tests | No. of Qs. | Max. Marks | Version | Time allotted for each test (Separately timed) |
|---|---|---|---|---|---|
| 1. | Reasoning & Computer Aptitude | 40 | 50 | Only English | 40 minutes |
| 2. | General/ Economy/ Banking Awareness | 40 | 50 | 20 minutes | |
| 3. | English Language | 40 | 50 | 40 minutes | |
| 4. | Data Analysis & Interpretation | 40 | 50 | 40 minutes | |
| Total | 160 | 200 | 140 minutes | ||
- Tabular graph
- Pie charts
- Miscellaneous Topics
- Data Sufficiency
- Radar Graphs
- Permutation and Combination
- Line charts
- Line Graph
- Tables
- Probability
- Bar Graphs
- Mixed Graphs
Note : There will be 1/4 penalty for wrong answers
Tests will be made available only in English.
Samples
Directions (1- 5): The following line graph gives the percent profit earned by two Companies X and Y during the period 1996 - 2001.
Percentage profit earned by Two Companies X and Y over the Given Years
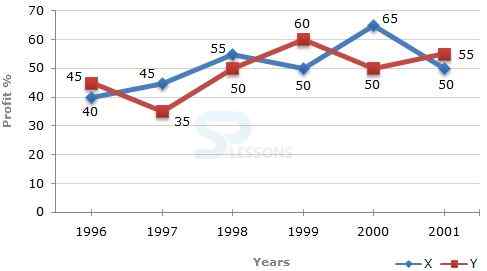 1. The incomes of two Companies X and Y in 2000 were in the ratio of 3:4 respectively. What was the respective ratio of their expenditures in 2000 ?
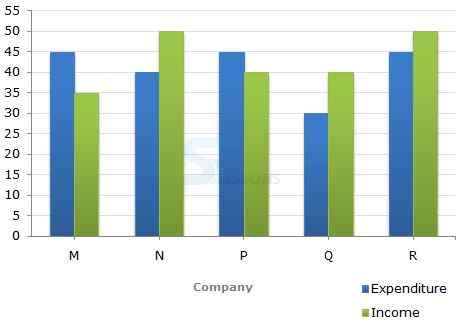 6. The companies M and N together had a percentage of profit/loss of?
% Profit = [latex]\frac{Income - Expenditure}{Expenditure} \times 100[/latex]
-
A. 7:22
B. 14:19
C. 15:22
D. 27:35
-
A. Rs. 312 crores
B. Rs. 297 crores
C. Rs. 283 crores
D. Rs. 275 crores
-
A. Rs. 240 crores
B. Rs. 171 crores
C. Rs. 120 crores
D. Rs. 102 crores
-
A. Rs. 465 crores
B. Rs. 385 crores
C. Rs. 335 crores
D. Rs. 295 crores
-
A. 6:5
B. 5:6
C. 11:6
D. 16:15
% Profit/Loss = [latex]\frac{Income - Expenditure}{Expenditure} \times 100[/latex]
Income and Expenditure (in million US $) of five companies in the year 2001.
-
A. 12% loss
B. 10% loss
C. 10% profit
D. There was no loss or profit
-
A. 5% profit
B. 6.5% profit
C. 4% loss
D. 7% loss
-
A. M
B. N
C. P
D. Q
-
A. 35.75
B. 37.25
C. 38.5
D. 41.25
-
A. 28.28
B. 30.30
C. 32.32
D. 34.34