 Description
A
time series is a movement of data centers recorded in time mastermind. Most regularly, a period game plan is a gathering taken at dynamic comparably scattered concentrations in time. Along these lines, it is a gathering of discrete-time data. Instances of time game plan are statures of ocean tides, counts of sunspots.
A time series are once in a while plotted by the method for line outlines. Time course of action are used as a piece of bits of knowledge, banner taking care of, plan affirmation, econometrics, numerical back, atmosphere evaluating, astute transport and heading gauging, seismic tremor figure, electroencephalography, control building, space science, correspondences building, and by and large in any zone of associated science and outlining which incorporates transient estimations.  Example
The following is an example.
JavaJFreeChartTimeSeriesExample.java
[java]package com.splessons;
import java.awt.Color;
import java.text.SimpleDateFormat;
import javax.swing.JPanel;
import org.jfree.chart.ChartFactory;
import org.jfree.chart.ChartPanel;
import org.jfree.chart.JFreeChart;
import org.jfree.chart.axis.DateAxis;
import org.jfree.chart.plot.XYPlot;
import org.jfree.chart.renderer.xy.XYItemRenderer;
import org.jfree.chart.renderer.xy.XYLineAndShapeRenderer;
import org.jfree.data.time.Month;
import org.jfree.data.time.TimeSeries;
import org.jfree.data.time.TimeSeriesCollection;
import org.jfree.data.xy.XYDataset;
import org.jfree.ui.ApplicationFrame;
import org.jfree.ui.RectangleInsets;
import org.jfree.ui.RefineryUtilities;
public class JavaJFreeChartTimeSeriesExample extends ApplicationFrame {
public JavaJFreeChartTimeSeriesExample(String title) {
super(title);
XYDataset dataset = createDataset();
JFreeChart chart = createChart(dataset);
ChartPanel chartPanel = new ChartPanel(chart, false);
chartPanel.setPreferredSize(new java.awt.Dimension(500, 270));
chartPanel.setMouseZoomable(true, false);
setContentPane(chartPanel);
}
private static JFreeChart createChart(XYDataset dataset) {
JFreeChart chart = ChartFactory.createTimeSeriesChart(
"General Unit Trust Prices", // title
"Date", // x-axis label
"Price Per Unit", // y-axis label
dataset, // data
true, // create legend?
true, // generate tooltips?
false // generate URLs?
);
chart.setBackgroundPaint(Color.white);
XYPlot plot = (XYPlot) chart.getPlot();
plot.setBackgroundPaint(Color.lightGray);
plot.setDomainGridlinePaint(Color.white);
plot.setRangeGridlinePaint(Color.white);
plot.setAxisOffset(new RectangleInsets(5.0, 5.0, 5.0, 5.0));
plot.setDomainCrosshairVisible(true);
plot.setRangeCrosshairVisible(true);
XYItemRenderer r = plot.getRenderer();
if (r instanceof XYLineAndShapeRenderer) {
XYLineAndShapeRenderer renderer = (XYLineAndShapeRenderer) r;
}
DateAxis axis = (DateAxis) plot.getDomainAxis();
axis.setDateFormatOverride(new SimpleDateFormat("MMM-yyyy"));
return chart;
}
private static XYDataset createDataset() {
TimeSeries s1 = new TimeSeries("L&G European Index Trust", Month.class);
s1.add(new Month(2, 2001), 181.8);
s1.add(new Month(3, 2001), 167.3);
s1.add(new Month(4, 2001), 153.8);
s1.add(new Month(5, 2001), 167.6);
s1.add(new Month(6, 2001), 158.8);
s1.add(new Month(7, 2001), 148.3);
s1.add(new Month(8, 2001), 153.9);
s1.add(new Month(9, 2001), 142.7);
s1.add(new Month(10, 2001), 123.2);
s1.add(new Month(11, 2001), 131.8);
s1.add(new Month(12, 2001), 139.6);
s1.add(new Month(1, 2002), 142.9);
s1.add(new Month(2, 2002), 138.7);
s1.add(new Month(3, 2002), 137.3);
s1.add(new Month(4, 2002), 143.9);
s1.add(new Month(5, 2002), 139.8);
s1.add(new Month(6, 2002), 137.0);
s1.add(new Month(7, 2002), 132.8);
TimeSeries s2 = new TimeSeries("L&G UK Index Trust", Month.class);
s2.add(new Month(2, 2001), 129.6);
s2.add(new Month(3, 2001), 123.2);
s2.add(new Month(4, 2001), 117.2);
s2.add(new Month(5, 2001), 124.1);
s2.add(new Month(6, 2001), 122.6);
s2.add(new Month(7, 2001), 119.2);
s2.add(new Month(8, 2001), 116.5);
s2.add(new Month(9, 2001), 112.7);
s2.add(new Month(10, 2001), 101.5);
s2.add(new Month(11, 2001), 106.1);
s2.add(new Month(12, 2001), 110.3);
s2.add(new Month(1, 2002), 111.7);
s2.add(new Month(2, 2002), 111.0);
s2.add(new Month(3, 2002), 109.6);
s2.add(new Month(4, 2002), 113.2);
s2.add(new Month(5, 2002), 111.6);
s2.add(new Month(6, 2002), 108.8);
s2.add(new Month(7, 2002), 101.6);
TimeSeriesCollection dataset = new TimeSeriesCollection();
dataset.addSeries(s1);
dataset.addSeries(s2);
dataset.setDomainIsPointsInTime(true);
return dataset;
}
public static JPanel createDemoPanel() {
JFreeChart chart = createChart(createDataset());
return new ChartPanel(chart);
}
public static void main(String[] args) {
JavaJFreeChartTimeSeriesExample demo = new JavaJFreeChartTimeSeriesExample(
"SPLESSONS - Time Series Chart Demo"
);
demo.pack();
RefineryUtilities.centerFrameOnScreen(demo);
demo.setVisible(true);
}
}
[/java]
Time series data have a trademark firm chart. This sets aside a couple of minutes plan examination specific from cross-sectional studies, in which there is no ordinary asking for the discernments. Time game plan examination is also specific from spatial data examination where the observations regularly relate to topographical regions.
A stochastic model for a period course of action will generally reflect the way that observations almost each other in time will be more solidly related than discernments progress isolated.
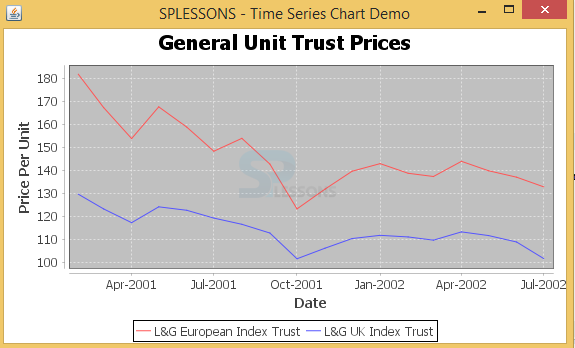
Output: Now compile the code result will be as follows.
 Key Points
- To expose the sequence of data points times series chart will be used.
- A time series is one sort of Panel information. Panel information is the general class, a multidimensional information set.


