 Description
A round factual realistic is known as
pie chart is partitioned into numerous cuts to delineates numeric segment. pie outline shows the information, data, and insights in a simple to read'pie-cut' configuration. In a pie outline, every cut bend length ought to be proportional to the amount it speaks to. Fundamental utilization of pie graph is to show comparison when things are displayed in pie outline client can undoubtedly observe which one is most prominent and which is the minimum mainstream. pie outlines are primarily utilized as a part of business, home, school.  Description
Abstract Window Toolkit has a set of libraries that can be helpful in making graphics for gaming products, banking services, educational purposes and much more. An object change from one state to another state, when used in an application, is known as an event. Events occur when the user communicates with the Graphical User Interface. There are two types of AWT Events, they are:
- Background Events: The events that does not require the user action are known as Background Events. Software interruptions, and operating system failure are some background events.
- Foreground Events: The events that require the user interaction are known as Foreground Events. Mouse click, and entering a character from the keyboard are some examples.
 Example
The following is an example that depending on the majority table.
PieChart_AWT.java
[java]package com.splessons;
import javax.swing.JPanel;
import org.jfree.chart.ChartFactory;
import org.jfree.chart.ChartPanel;
import org.jfree.chart.JFreeChart;
import org.jfree.data.general.DefaultPieDataset;
import org.jfree.data.general.PieDataset;
import org.jfree.ui.ApplicationFrame;
import org.jfree.ui.RefineryUtilities;
public class PieChart_AWT extends ApplicationFrame
{
public PieChart_AWT( String title )
{
super( title );
setContentPane(createDemoPanel( ));
}
private static PieDataset createDataset( )
{
DefaultPieDataset dataset = new DefaultPieDataset( );
dataset.setValue( "Donald Trump" , new Double( 50 ) );
dataset.setValue( "Hillary clinton" , new Double( 45 ) );
dataset.setValue( "Gary Johnson" , new Double( 5 ) );
return dataset;
}
private static JFreeChart createChart( PieDataset dataset )
{
JFreeChart chart = ChartFactory.createPieChart(
"Election Poll", // chart title
dataset, // data
true, // include legend
true,
false);
return chart;
}
public static JPanel createDemoPanel( )
{
JFreeChart chart = createChart(createDataset( ) );
return new ChartPanel( chart );
}
public static void main( String[ ] args )
{
PieChart_AWT demo = new PieChart_AWT( "SPLesson Survey" );
demo.setSize( 560 , 367 );
RefineryUtilities.centerFrameOnScreen( demo );
demo.setVisible( true );
}
}
[/java]
The following is the code to keep the frame in center of the screen.
[java]RefineryUtilities.centerFrameOnScreen(demo);[/java]
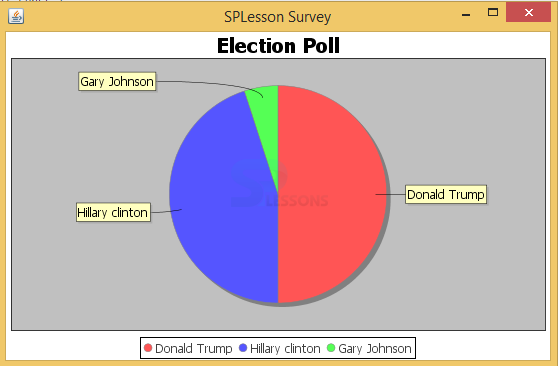
Output: Now compile the code result will be as follows.
| Candidate | Majority |
|---|---|
| Donald Trump | 50 |
| Hillary clinton | 45 |
| Gary Johnson | 5 |
 Key Points
- Pie graphs are broadly utilized as a part of the business world and the broad communications
- In some exceptionally uncommon occasions, pie graphs can be found in square shape.
- The French designer Charles Joseph Minard was used pie diagrams in 1858.


