 Description
As of now Splessons covered some topics which related to basic chart diagrams and their functionalities. Dynamic data means the result will be produced depends on user requirements that means one can test the output after compiling, the following is an example which describes and shows how dynamically chart flows.
 Example
The following is an example.
JavaJFreeChartDynmicDataDemo.java
[java]package com.splessons;
import java.awt.BorderLayout;
import java.awt.event.ActionEvent;
import java.awt.event.ActionListener;
import javax.swing.JButton;
import javax.swing.JPanel;
import org.jfree.chart.ChartFactory;
import org.jfree.chart.ChartPanel;
import org.jfree.chart.JFreeChart;
import org.jfree.chart.axis.ValueAxis;
import org.jfree.chart.plot.XYPlot;
import org.jfree.data.time.Millisecond;
import org.jfree.data.time.TimeSeries;
import org.jfree.data.time.TimeSeriesCollection;
import org.jfree.data.xy.XYDataset;
import org.jfree.ui.ApplicationFrame;
import org.jfree.ui.RefineryUtilities;
public class JavaJFreeChartDynmicDataDemo extends ApplicationFrame implements ActionListener {
/** The time series data. */
private TimeSeries series;
private double lastValue = 100.0;
public JavaJFreeChartDynmicDataDemo(final String title) {
super(title);
this.series = new TimeSeries("Random Data", Millisecond.class);
final TimeSeriesCollection dataset = new TimeSeriesCollection(this.series);
final JFreeChart chart = createChart(dataset);
final ChartPanel chartPanel = new ChartPanel(chart);
final JButton button = new JButton("Add New Data Item");
button.setActionCommand("ADD_DATA");
button.addActionListener(this);
final JPanel content = new JPanel(new BorderLayout());
content.add(chartPanel);
content.add(button, BorderLayout.SOUTH);
chartPanel.setPreferredSize(new java.awt.Dimension(500, 270));
setContentPane(content);
}
private JFreeChart createChart(final XYDataset dataset) {
final JFreeChart result = ChartFactory.
createTimeSeriesChart("Dynamic Data Demo", "Time", "Value", dataset,
true, true, false);
final XYPlot plot = result.getXYPlot();
ValueAxis axis = plot.getDomainAxis();
axis.setAutoRange(true);
axis.setFixedAutoRange(60000.0); // 60 seconds
axis = plot.getRangeAxis();
axis.setRange(0.0, 200.0);
return result;
}
public void actionPerformed(final ActionEvent e) {
if (e.getActionCommand().equals("ADD_DATA")) {
final double factor = 0.90 + 0.2 * Math.random();
this.lastValue = this.lastValue * factor;
final Millisecond now = new Millisecond();
System.out.println("Now = " + now.toString());
this.series.add(new Millisecond(), this.lastValue);
}
}
public static void main(final String[] args) {
final JavaJFreeChartDynmicDataDemo demo = new
JavaJFreeChartDynmicDataDemo("Splessons - Dynamic Data Demo");
demo.pack();
RefineryUtilities.centerFrameOnScreen(demo);
demo.setVisible(true);
}
}
[/java]
In the above example, the developer created the button as
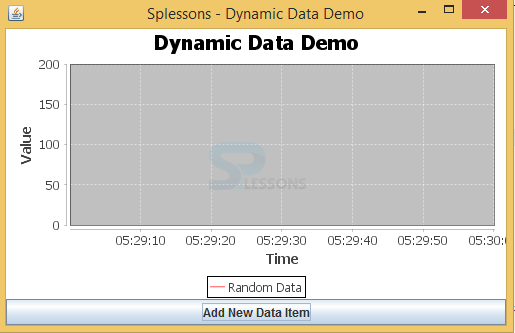
Add New Data Item, when click on this button extra result will be added in the console.
Output: Now compile the code result will be as follows.
A time series are once in a while plotted by the method for line outlines. Time course of action are used as a piece of bits of knowledge, banner taking care of, plan affirmation, econometrics, numerical back, atmosphere evaluating, astute transport and heading gauging, seismic tremor figure, electroencephalography, control building, space science, correspondences building, and by and large in any zone of associated science and outlining which incorporates transient estimations.
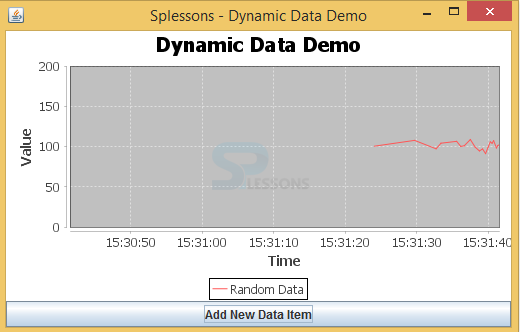
Now click on the Add New Data Item button. The following is the corresponding data will be displayed in the console.
[java]Now = Wed Nov 30 15:31:24 IST 2016
Now = Wed Nov 30 15:31:29 IST 2016
Now = Wed Nov 30 15:31:32 IST 2016
Now = Wed Nov 30 15:31:33 IST 2016
Now = Wed Nov 30 15:31:35 IST 2016
Now = Wed Nov 30 15:31:36 IST 2016
Now = Wed Nov 30 15:31:36 IST 2016
Now = Wed Nov 30 15:31:37 IST 2016
Now = Wed Nov 30 15:31:38 IST 2016
Now = Wed Nov 30 15:31:38 IST 2016
Now = Wed Nov 30 15:31:39 IST 2016
Now = Wed Nov 30 15:31:39 IST 2016
Now = Wed Nov 30 15:31:40 IST 2016
Now = Wed Nov 30 15:31:40 IST 2016
Now = Wed Nov 30 15:31:40 IST 2016
Now = Wed Nov 30 15:31:40 IST 2016
Now = Wed Nov 30 15:31:41 IST 2016
Now = Wed Nov 30 15:31:41 IST 2016
Now = Wed Nov 30 15:31:41 IST 2016
[/java]
The following is the new chart after adding some new data items.
 Key Points
- Dynamic chart will be used in big firms such as sensex.
- Controls are components that communicate with the users.
- The
getActionCommand()gives you a String representing the action command.


