 Description
A
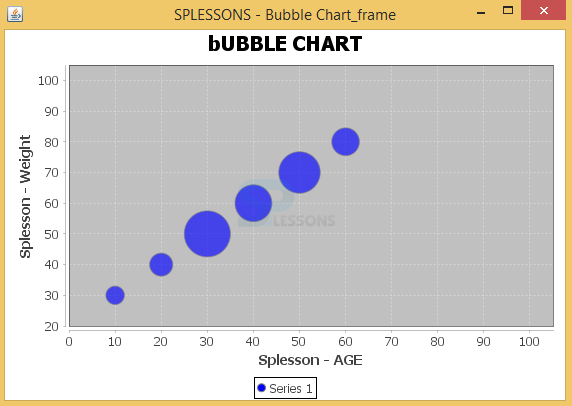
bubble chart is a sort of chart that showcases three estimations of information. Bubble layouts can empower the understanding of social, judicious, restorative, and other legitimate associations.
Bubble outlines can be seen as an assortment of the diffuse plot, in which the data centers are supplanted with bubbles. As the documentation for Microsoft Office elucidates, customer can use the bubble graph instead of a scatter diagram if the data has three data course of action that each contain a plan of characteristics. The sizes of the bubble diagrams are managed by the qualities in the third data course of action.  Example
The following is an example.
JavaJFreeChartBubbleChart.java
[java]package com.splessons;
import java.awt.Color;
import java.awt.Dimension;
import javax.swing.JPanel;
import org.jfree.chart.*;
import org.jfree.chart.axis.NumberAxis;
import org.jfree.chart.plot.PlotOrientation;
import org.jfree.chart.plot.XYPlot;
import org.jfree.chart.renderer.xy.XYItemRenderer;
import org.jfree.data.xy.DefaultXYZDataset;
import org.jfree.data.xy.XYZDataset;
import org.jfree.ui.ApplicationFrame;
import org.jfree.ui.RefineryUtilities;
public class JavaJFreeChartBubbleChart extends ApplicationFrame {
public JavaJFreeChartBubbleChart(String s) {
super(s);
JPanel jpanel = createDemoPanel();
jpanel.setPreferredSize(new Dimension(560, 370));
setContentPane(jpanel);
}
private static JFreeChart createChart(XYZDataset xyzdataset) {
JFreeChart jfreechart = ChartFactory.createBubbleChart("bUBBLE CHART", "Splesson - Weight", "Splesson - AGE", xyzdataset,
PlotOrientation.HORIZONTAL, true, true, false);
XYPlot xyplot = (XYPlot) jfreechart.getPlot();
xyplot.setForegroundAlpha(0.65F);
XYItemRenderer xyitemrenderer = xyplot.getRenderer();
xyitemrenderer.setSeriesPaint(0, Color.blue);
NumberAxis numberaxis = (NumberAxis) xyplot.getDomainAxis();
numberaxis.setLowerMargin(0.2);
numberaxis.setUpperMargin(0.5);
NumberAxis numberaxis1 = (NumberAxis) xyplot.getRangeAxis();
numberaxis1.setLowerMargin(0.8);
numberaxis1.setUpperMargin(0.9);
return jfreechart;
}
public static XYZDataset createDataset() {
DefaultXYZDataset defaultxyzdataset = new DefaultXYZDataset();
double ad[] = { 30, 40, 50, 60, 70, 80 };
double ad1[] = { 10, 20, 30, 40, 50, 60 };
double ad2[] = { 4, 5, 10, 8, 9, 6 };
double ad3[][] = { ad, ad1, ad2 };
defaultxyzdataset.addSeries("Series 1", ad3);
return defaultxyzdataset;
}
public static JPanel createDemoPanel() {
JFreeChart jfreechart = createChart(createDataset());
ChartPanel chartpanel = new ChartPanel(jfreechart);
chartpanel.setDomainZoomable(true);
chartpanel.setRangeZoomable(true);
return chartpanel;
}
public static void main(String args[]) {
JavaJFreeChartBubbleChart bubblechart = new JavaJFreeChartBubbleChart("SPLESSONS - Bubble Chart_frame");
bubblechart.pack();
RefineryUtilities.centerFrameOnScreen(bubblechart);
bubblechart.setVisible(true);
}
}
[/java]
In the above example the class
JavaJFreeChartBubbleChart is extending ApplicationFrame that means all the properties of ApplicationFrame will be used by the class.
[java]public class JavaJFreeChartBubbleChart extends ApplicationFrame[/java]
Output: Now compile the code result will be as follows.
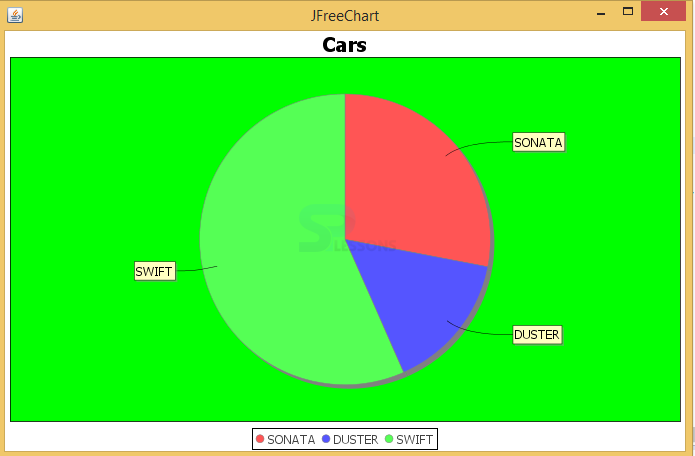
The following is an example for the background color in JFreechart.
[java]package com.splessons;
import java.awt.Color;
import org.jfree.chart.ChartFactory;
import org.jfree.chart.ChartFrame;
import org.jfree.chart.JFreeChart;
import org.jfree.chart.plot.Plot;
import org.jfree.data.general.DefaultPieDataset;
public class JavaJFreeChartBackgroundPaint {
public static void main(String[] args) {
DefaultPieDataset dataset = new DefaultPieDataset();
dataset.setValue("SONATA", 40.1);
dataset.setValue("DUSTER", 22);
dataset.setValue("SWIFT", 81);
// Creation Of Chart.
JFreeChart chart = ChartFactory.createPieChart("Cars", dataset, true, // legend?
true, // tooltips?
false // URLs?
);
ChartFrame frame = new ChartFrame("JFreeChart", chart);
Plot plot = chart.getPlot();
plot.setBackgroundPaint(Color.green);
frame.pack();
frame.setVisible(true);
}
}
[/java]
Output: Now compile the code result will be as follows.
 Key Points
- Bubble diagrams plot information characterized regarding three unmistakable numeric parameters.
- Bubble graphs can be viewed as a variety of the diffuse plot, in which the information focuses are supplanted with bubbles.
- A Bubble Chart is a multi-variable diagram that is a combination of a Proportional Area Chart aND Scatterplot.


