 Description
The
bar graph is a blueprint that presents accumulated data with rectangular bars with lengths relating to the qualities that they address. The bars can be plotted vertically or equitably. A vertical bar graph is occasionally called a Line outline.
A bar graph is a blueprint that use either level or vertical bars to show connections among groupings. One center of the diagram shows the specific classes being contemplated, and exchange turn addresses a discrete regard. Some visual diagrams show bars grouped in social occasions of more than one.
 Example
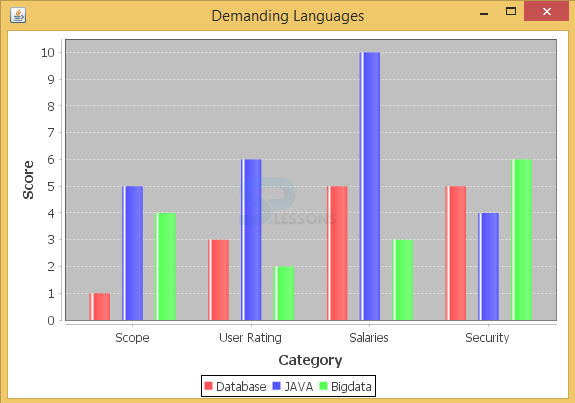
The following is an example to know the coding language popularity in the present market.
BarChart_AWT.java
[java]package com.splessons;
import org.jfree.chart.ChartFactory;
import org.jfree.chart.ChartPanel;
import org.jfree.chart.JFreeChart;
import org.jfree.chart.plot.PlotOrientation;
import org.jfree.data.category.CategoryDataset;
import org.jfree.data.category.DefaultCategoryDataset;
import org.jfree.ui.ApplicationFrame;
import org.jfree.ui.RefineryUtilities;
public class BarChart_AWT extends ApplicationFrame
{
public BarChart_AWT( String applicationTitle , String chartTitle )
{
super( applicationTitle );
JFreeChart barChart = ChartFactory.createBarChart(
chartTitle,
"Category",
"Score",
createDataset(),
PlotOrientation.VERTICAL,
true, true, false);
ChartPanel chartPanel = new ChartPanel( barChart );
chartPanel.setPreferredSize(new java.awt.Dimension( 560 , 367 ) );
setContentPane( chartPanel );
}
private CategoryDataset createDataset( )
{
final String database = "Database";
final String java = "JAVA";
final String bigdata = "Bigdata";
final String scope = "Scope";
final String salaries = "Salaries";
final String userrating = "User Rating";
final String security = "Security";
final DefaultCategoryDataset dataset =
new DefaultCategoryDataset( );
dataset.addValue( 1.0 , database , scope );
dataset.addValue( 3.0 , database , userrating );
dataset.addValue( 5.0 , database , salaries );
dataset.addValue( 5.0 , database , security );
dataset.addValue( 5.0 , java , scope );
dataset.addValue( 6.0 , java , userrating );
dataset.addValue( 10.0 , java , salaries );
dataset.addValue( 4.0 , java , security );
dataset.addValue( 4.0 , bigdata , scope );
dataset.addValue( 2.0 , bigdata , userrating );
dataset.addValue( 3.0 , bigdata , salaries );
dataset.addValue( 6.0 , bigdata , security );
return dataset;
}
public static void main( String[ ] args )
{
BarChart_AWT chart = new BarChart_AWT("Demanding Languages", null);
chart.pack( );
RefineryUtilities.centerFrameOnScreen( chart );
chart.setVisible( true );
}
}[/java]
In the above example the class
BarChart_AWT is extending ApplicationFrame that means all the properties of ApplicationFrame will be used by the class.
[java]public class BarChart_AWT extends ApplicationFrame[/java]
Bar graphs have a discrete range. Reference charts are by and large scaled so that each one of the data can fit on the blueprint. Bars on the framework may be composed in any demand. Oust charts sorted out from most lifted to minimum rate are called Pareto diagrams. Normally, bars demonstrating repeat will be sorted out in consecutive progression.
Output: Now compile the code result will be as follows.
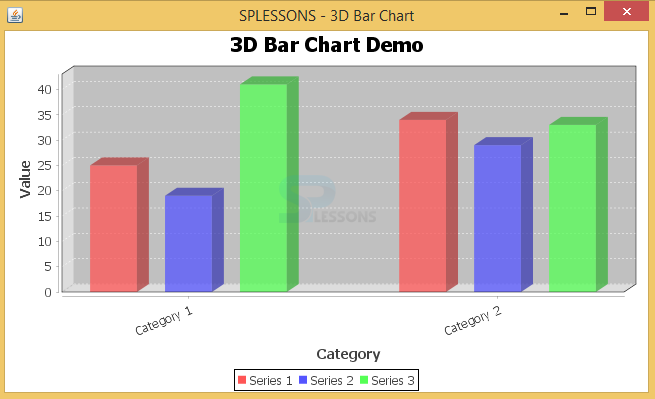
The following is an another example of bar chart with 3D format.
[java]package com.splessons;
import org.jfree.chart.ChartFactory;
import org.jfree.chart.ChartPanel;
import org.jfree.chart.JFreeChart;
import org.jfree.chart.axis.CategoryAxis;
import org.jfree.chart.axis.CategoryLabelPositions;
import org.jfree.chart.plot.CategoryPlot;
import org.jfree.chart.plot.PlotOrientation;
import org.jfree.chart.renderer.category.BarRenderer;
import org.jfree.chart.renderer.category.CategoryItemRenderer;
import org.jfree.data.category.CategoryDataset;
import org.jfree.data.category.DefaultCategoryDataset;
import org.jfree.ui.ApplicationFrame;
import org.jfree.ui.RefineryUtilities;
public class JavaJFreeChartBarChart3D extends ApplicationFrame {
public JavaJFreeChartBarChart3D(final String title) {
super(title);
final CategoryDataset dataset = createDataset();
final JFreeChart chart = createChart(dataset);
final ChartPanel chartPanel = new ChartPanel(chart);
chartPanel.setPreferredSize(new java.awt.Dimension(500, 270));
setContentPane(chartPanel);
}
private CategoryDataset createDataset() {
final DefaultCategoryDataset dataset = new DefaultCategoryDataset();
dataset.addValue(25.0, "Series 1", "Category 1");
dataset.addValue(34.0, "Series 1", "Category 2");
dataset.addValue(19.0, "Series 2", "Category 1");
dataset.addValue(29.0, "Series 2", "Category 2");
dataset.addValue(41.0, "Series 3", "Category 1");
dataset.addValue(33.0, "Series 3", "Category 2");
return dataset;
}
private JFreeChart createChart(final CategoryDataset dataset) {
final JFreeChart chart = ChartFactory.createBarChart3D("3D Bar Chart Demo", // chart
// title
"Category", // domain axis label
"Value", // range axis label
dataset, // data
PlotOrientation.VERTICAL, // orientation
true, // include legend
true, // tooltips
false // urls
);
final CategoryPlot plot = chart.getCategoryPlot();
final CategoryAxis axis = plot.getDomainAxis();
axis.setCategoryLabelPositions(CategoryLabelPositions.createUpRotationLabelPositions(Math.PI / 8.0));
final CategoryItemRenderer renderer = plot.getRenderer();
renderer.setItemLabelsVisible(true);
final BarRenderer r = (BarRenderer) renderer;
// r.setMaxBarWidth(0.05);
return chart;
}
public static void main(final String[] args) {
final JavaJFreeChartBarChart3D demo = new JavaJFreeChartBarChart3D("SPLESSONS - 3D Bar Chart");
demo.pack();
RefineryUtilities.centerFrameOnScreen(demo);
demo.setVisible(true);
}
}
[/java]
Output: Now compile the code result will be as follows.
Bar graph diagrams give a visual presentation of hard and fast data. Categorical data is a social occasion of data into discrete get-togethers, for instance, months of the year, age pack, shoe sizes, and animals. These arrangements are regularly subjective. In a section bar graph, the classes appear along the level center; the stature of the bar analyzes to the estimation of each order.
 Key Points
- A bar chart utilizes either even or vertical bars to show contrast.
- Bar charts can likewise be utilized for more intricate examinations of information with assembled bar outlines
- The bar chart was invented by William Playfair.


