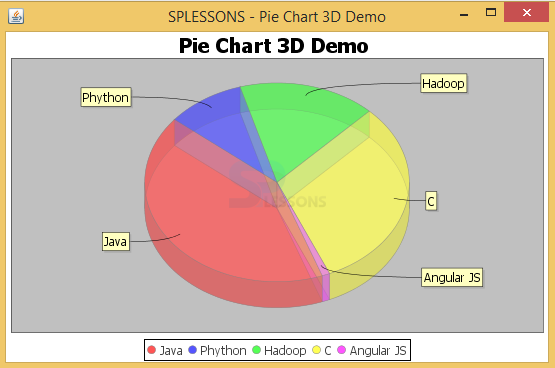
 Description
3D suggests three-dimensional, i.e. something that has width, stature and significance. Our physical surroundings is three-dimensional and we move around in 3D reliably.
Individuals can see the spatial relationship between articles just by looking since we have 3D wisdom, generally called significance perception. As we look around, the retina in each eye outlines a two-dimensional photo of our surroundings and our cerebrum shapes these two pictures into a 3D visual trial.
 Example
The following is an example to show the effect.
JavaJFreeChartPieChart3D.java
[java]package com.splessons;
import org.jfree.chart.ChartFactory;
import org.jfree.chart.ChartPanel;
import org.jfree.chart.JFreeChart;
import org.jfree.chart.plot.PiePlot3D;
import org.jfree.data.general.DefaultPieDataset;
import org.jfree.data.general.PieDataset;
import org.jfree.ui.ApplicationFrame;
import org.jfree.ui.RefineryUtilities;
import org.jfree.util.Rotation;
public class JavaJFreeChartPieChart3D extends ApplicationFrame {
public JavaJFreeChartPieChart3D(final String title) {
super(title);
final PieDataset dataset = createSampleDataset();
final JFreeChart chart = createChart(dataset);
final ChartPanel chartPanel = new ChartPanel(chart);
chartPanel.setPreferredSize(new java.awt.Dimension(500, 270));
setContentPane(chartPanel);
}
private PieDataset createSampleDataset() {
final DefaultPieDataset result = new DefaultPieDataset();
result.setValue("Java", new Double(43.2));
result.setValue("Phython", new Double(10.0));
result.setValue("Hadoop", new Double(17.5));
result.setValue("C", new Double(32.5));
result.setValue("Angular JS", new Double(1.0));
return result;
}
private JFreeChart createChart(final PieDataset dataset) {
final JFreeChart chart = ChartFactory.createPieChart3D("Pie Chart 3D Demo ", // chart
// title
dataset, // data
true, // include legend
true, false);
final PiePlot3D plot = (PiePlot3D) chart.getPlot();
plot.setStartAngle(290);
plot.setDirection(Rotation.CLOCKWISE);
plot.setForegroundAlpha(0.5f);
plot.setNoDataMessage("No data to display");
return chart;
}
public static void main(final String[] args) {
final JavaJFreeChartPieChart3D demo = new JavaJFreeChartPieChart3D("SPLESSONS - Pie Chart 3D Demo");
demo.pack();
RefineryUtilities.centerFrameOnScreen(demo);
demo.setVisible(true);
}
}
[/java]
The
result.setvalue is used to add the chart partition name in the circle.
[java]result.setValue("Java", new Double(43.2));
result.setValue("Phython", new Double(10.0));
result.setValue("Hadoop", new Double(17.5));
result.setValue("C", new Double(32.5));
result.setValue("Angular JS", new Double(1.0));[/java]
The following is the code to keep the frame in center of the screen.
[java]RefineryUtilities.centerFrameOnScreen(demo);[/java]
Output:Now compile the code then the result will be as follows.
The ResultSet interface broadcasts getter procedures for recouping section values from the present segment. You can recuperate values using either the document number of the segment or the accepted name or name of the portion. The fragment document is ordinarily more capable. Segments are numbered from 1.
 Key Points
- A pie diagram is a specific chart utilized as a part of measurements.
- A 3D Pie outline is same as the pie diagram furthermore with a decent 3D impact.
- The fundamental utilization of a pie graph is to show examination. At the point when things are exhibited on a pie outline.


