


 Introduction
When writing code, sometimes the code gets disturbed due to some mistakes in programs or scripts. These mistakes are called as bugs. To get a successful output, the developer has to figure out and fix the bugs. This process is called as JavaScript Debugging.
Description
Debugging JavaScript is very difficult as no indications of errors will be shown and hence there is a need for powerful debugging tools.
All the modern browsers have built-in debuggers with which break-points can also be set. The following are the two things that can make the debugging easier:
- Place the JavaScript as an external file [c]<script type="text/javascript" src="http://www.wired.com/images/archiveyscript.js"></script>[/c] By doing this, the text editor can match with line numbers of the browser.
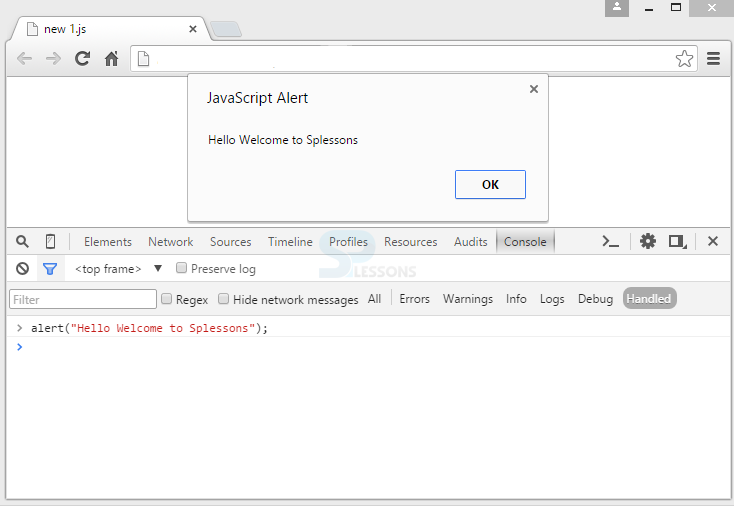
- Always open the JavaScript console on the browser.console.log() method. The method can be used to display the JavaScript values in debugger window as shown below. [c] <script> x = 5; y = 6; z = a + b; console.log(z); </script>[/c]
Debugger
Window
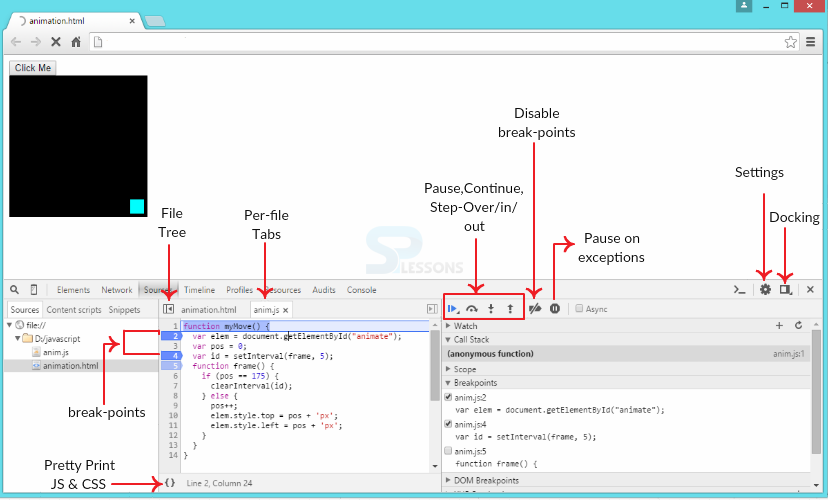
Description
Always open the JavaScript console on the browser.
Google Chrome has DevTools, which can debug the JavaScript code. To debug, developer needs to open the browser and go to Menu-> Select More Tools->Developer Tools->select Console. Then, the JavaScript can be debugged by entering the script in Console as shown below.
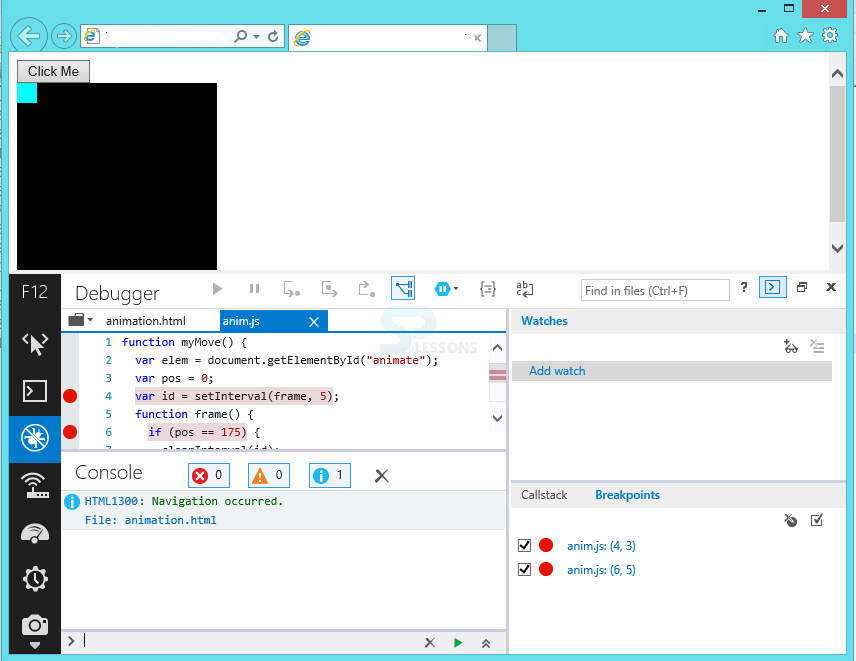
Description
Debugging in Internet Explorer is the same as Debugging in Chrome.
User needs to open the browser->Select Tools -> Click on F12 Developer Tools. The Debugger opens showing the sources present. Console tab can be seen here, which shows a number of errors, warnings, and messages.
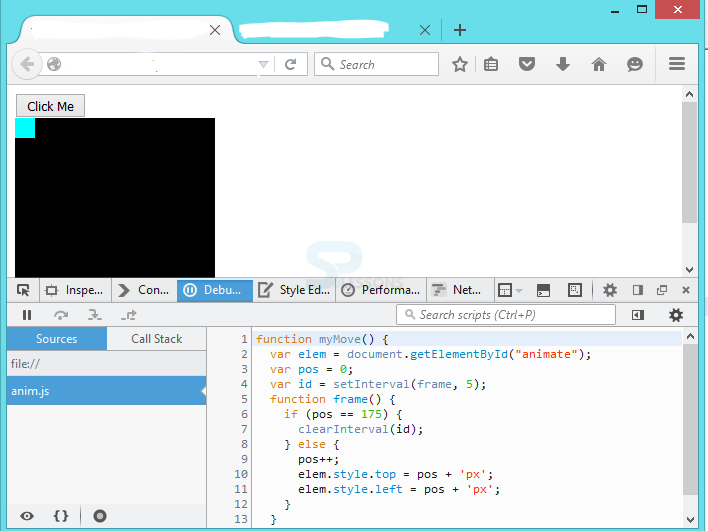
Description
In Firefox browser, to debug the JavaScript code, a user should go to Menu->Select Developer->Click on Debugger. If the debugger is not present, it can be downloaded. But, the recent versions of Firefox consists of inbuilt JavaScript Debugging.
Key Points
- JavaScript Debugging is the process of finding bugs in a code.
- All latest browsers have inbuilt JavaScript Debugging.
- Clicking F12 is the best way to go to console window in a browser.
Programming
Tips
- Usage of comments will reduce the bugs in code.
- Functions can be used to reduce the errors.
- Dividing and testing the scripts will be useful when working with long scripts.