


 Introduction
Highcharts bubble charts are used to draw bubble based charts. This chapter explains about the various types of bubble charts and how to create a bubble chart.
Description
A Bubble chart represents the data point with bubbles and allows the user to view the data in three dimensions. Bubble charts are quite similar to scatter charts that do not use a category axis instead uses the horizontal and vertical axis as value axis.
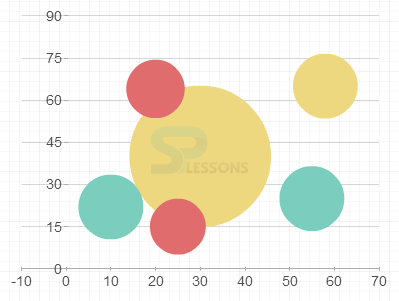
Bubble chart uses X, Y and Z parameters for representing the data. The Z parameter is used to determine the size of the bubble, whereas, the X and Y parameters are used to determine the position of the bubble.
Conceptual
figure
Below image shows the data representation in Bubble chart.
Description
Following are the two types of bubble charts that can be represented using Highcharts.
- Basic Bubble chart
- 3D Bubble chart
Description
A basic bubble chart represents the data in 3 dimensions by using X, Y and Z parameters.
Example
Below example demonstrates how to create a basic bubble chart using CDN access for both the Highcharts and jQuery.
[c]
<!DOCTYPE html>
<html>
<head>
<title>Bubble charts</title>
<script src="https://ajax.googleapis.com/ajax/libs/jquery/2.2.0/jquery.min.js"></script>
<script src="http://code.highcharts.com/highcharts.js"></script>
<script src="http://code.highcharts.com/highcharts-more.js"></script>
</head>
<body>
<div id="container" style="width: 600px; height: 500px; margin: 0 auto"></div>
<script language="JavaScript">
$(function () {
$('#container').highcharts({
chart: {
type: 'bubble',
plotBorderWidth: 1,
zoomType: 'xy'
},
legend: {
enabled: false
},
title: {
text: 'Sugar and fat intake per country'
},
xAxis: {
gridLineWidth: 1,
title: {
text: 'Daily fat intake'
},
labels: {
format: '{value} gr'
},
plotLines: [{
color: 'red',
dashStyle: 'dot',
width: 3,
value: 65,
label: {
rotation: 0,
y: 15,
style: {
fontStyle: 'italic'
},
text: 'Safe fat intake 65g/day'
},
zIndex: 3
}]
},
yAxis: {
startOnTick: false,
endOnTick: false,
title: {
text: 'Daily sugar intake'
},
labels: {
format: '{value} gr'
},
maxPadding: 0.2,
plotLines: [{
color: 'red',
dashStyle: 'dot',
width: 3,
value: 50,
label: {
align: 'right',
style: {
fontStyle: 'italic'
},
text: 'Safe sugar intake 50g/day',
x: -10
},
zIndex: 3
}]
},
tooltip: {
useHTML: true,
headerFormat: '<table>',
pointFormat: '<tr><th colspan="2"><h3>{point.country}</h3></th></tr>' +
'<tr><th>Fat intake:</th><td>{point.x}g</td></tr>' +
'<tr><th>Sugar intake:</th><td>{point.y}g</td></tr>' +
'<tr><th>Obesity (adults):</th><td>{point.z}%</td></tr>',
footerFormat: '</table>',
followPointer: true
},
plotOptions: {
series: {
dataLabels: {
enabled: true,
format: '{point.name}'
}
}
},
series: [{
data: [
{ x: 95, y: 95, z: 13.8, name: 'BE', country: 'Belgium' },
{ x: 86.5, y: 102.9, z: 14.7, name: 'DE', country: 'Germany' },
{ x: 80.8, y: 91.5, z: 15.8, name: 'FI', country: 'Finland' },
{ x: 80.4, y: 102.5, z: 12, name: 'NL', country: 'Netherlands' },
{ x: 80.3, y: 86.1, z: 11.8, name: 'SE', country: 'Sweden' },
{ x: 78.4, y: 70.1, z: 16.6, name: 'ES', country: 'Spain' },
{ x: 74.2, y: 68.5, z: 14.5, name: 'FR', country: 'France' },
{ x: 73.5, y: 83.1, z: 10, name: 'NO', country: 'Norway' },
{ x: 71, y: 93.2, z: 24.7, name: 'UK', country: 'United Kingdom' },
{ x: 69.2, y: 57.6, z: 10.4, name: 'IT', country: 'Italy' },
{ x: 65.1, y: 64.8, z:17.2, name: 'IND', country: 'India'},
{ x: 68.6, y: 20, z: 16, name: 'RU', country: 'Russia' },
{ x: 65.5, y: 126.4, z: 35.3, name: 'US', country: 'United States' },
{ x: 65.4, y: 50.8, z: 28.5, name: 'HU', country: 'Hungary' },
{ x: 63.4, y: 51.8, z: 15.4, name: 'PT', country: 'Portugal' },
{ x: 64, y: 82.9, z: 31.3, name: 'NZ', country: 'New Zealand' }
]
}]
});
});
</script>
</body>
</html>
[/c]
Description
The 3D Bubble chart is a similar Bubble chart, but used to represent the data in 3 dimensional view.
Example
Below example demonstrates how to create a 3D bubble chart using CDN access for both Highcharts and jQuery.
[c]
<!DOCTYPE html>
<html>
<head>
<title>3D bubble charts</title>
<script src="https://ajax.googleapis.com/ajax/libs/jquery/2.2.0/jquery.min.js"></script>
<script src="http://code.highcharts.com/highcharts.js"></script>
<script src="http://code.highcharts.com/highcharts-more.js"></script>
</head>
<body>
<div id="container" style="width: 600px; height: 500px; margin: 0 auto"></div>
<script language="JavaScript">
$(function () {
$('#container').highcharts({
chart: {
type: 'bubble',
plotBorderWidth: 1,
zoomType: 'xy'
},
title: {
text: '3D Bubbles with radial gradient fill'
},
xAxis: {
gridLineWidth: 1
},
yAxis: {
startOnTick: false,
endOnTick: false
},
series: [{
data: [
[9, 81, 63],
[98, 5, 89],
[12, 16, 11],
[45, 35, 25],
[51, 50, 73],
[41, 22, 14],
[58, 24, 20],
[78, 37, 34],
[55, 56, 53],
[18, 45, 70],
[42, 44, 28],
[3, 52, 59],
[31, 18, 97],
[79, 91, 63],
[93, 23, 23],
[44, 83, 22]
],
marker: {
fillColor: {
radialGradient: { cx: 0.4, cy: 0.3, r: 0.7 },
stops: [
[0, 'rgba(80,215,228,0.5)'],
[1, Highcharts.Color(Highcharts.getOptions().colors[0]).setOpacity(0.4).get('rgba')]
]
}
}
}, {
data: [
[42, 38, 20],
[6, 18, 1],
[1, 93, 55],
[10, 17, 25],
[55, 70, 40],
[57, 2, 90],
[80, 76, 22],
[11, 74, 96],
[88, 56, 10],
[30, 47, 49],
[57, 62, 98],
[4, 16, 16],
[46, 10, 11],
[22, 87, 89],
[57, 91, 82],
[45, 15, 98]
],
marker: {
fillColor: {
radialGradient: { cx: 0.4, cy: 0.3, r: 0.7 },
stops: [
[0, 'rgba(166,227,298,0.5)'],
[1, Highcharts.Color(Highcharts.getOptions().colors[1]).setOpacity(0.4).get('rgba')]
]
}
}
}]
});
});
</script>
</body>
</html>
[/c]
Key Points
- Highcharts Bubble Charts - Bubble chart represents the data based on three parameters i.e. X, Y and Z.
- Highcharts Bubble Charts - The size of the bubble is nonlinear proportional to the z parameter in Bubble chart.
Programming
Tips
- Add the JavaScript file to the head section of the HTML page for creating a chart.
- Ensure that all the chart options or settings are correct before running the application.
- Give the chart type as bubble in the chart.type option.
- Using CDN access for both jQuery and Highcharts is an easy way for end-user to create Highcharts.